

Guide · limited scope
AASB S2 physical risk and financial effects
This guide covers one part of AASB S2: the assessment of physical climate risk and of its financial effects. It shows how to do this work yourself with the free ClimMate data and workbook. It is for finance, risk and sustainability teams in Australian entities. When you finish, you have a physical risk assessment, estimates of its financial effects, a method that a reviewer can follow, and draft text for these parts of your report.
This is not a full AASB S2 guide. It does not cover governance, transition risk, opportunities, greenhouse gas emissions or targets. For all of AASB S2, use the full AASB S2 guide. It uses this guide for its physical risk part.
Version 3.0, 13 November 2026. It refers to AASB S2 Climate-related Disclosures as amended by AASB S2025-1 (December 2025), and to the Corporations Act 2001 as we read them on that date. It is for annual reporting periods that start on or after 1 January 2025. The AASB S2025-1 amendments apply from 1 January 2027 (earlier application is permitted); they change greenhouse gas paragraphs, not the physical risk paragraphs. Owner: ClimMate. Next review: May 2027. Before you use this guide, check the versions that apply to your reporting period.
Part A · Purpose and requirements
What this guide does and does not do
Physical climate risk is one part of AASB S2. Your physical risk results go into your full assessment of climate-related risks and opportunities (AASB S2 paras 10–21), and into your climate resilience assessment (para 22). This guide is not a full AASB S2 implementation guide. It is not a method for transition risk. It does not make sure that your report complies.
You can do this yourself with this guide
- Set the boundary of the physical risk assessment, including the value chain
- Select the 1.5 °C and high scenarios, and map them to your horizons
- Get climate data for your sites and key suppliers
- Rate inherent and residual physical risks, and record adaptation measures
- Estimate the financial effects of physical risks
- Calculate the paragraph 29(c) metric
- Write draft text and keep the evidence
This guide does not cover
- Governance (paras 5–7)
- Transition risks and opportunities (paras 10–21)
- The full climate resilience assessment (para 22)
- Greenhouse gas emissions (para 29(a))
- The other metrics (paras 29(b), (d)–(g)) and targets (paras 33–36)
- The general requirements of Appendix D
The full AASB S2 guide covers these parts. ClimMate gives data for physical risk only.
Get specialist help when
- A site has a high flood, coastal or bushfire rating (get a local flood study or a site hazard assessment)
- A risk can have a material effect on asset values or impairment (speak to your finance team and auditor)
- Your obligations are not clear (read ASIC RG 280 or get legal advice)
- You need hazards that ClimMate does not give, for example cyclone wind or hail
You will make
- A site register and a supplier register
- A scenario table and an assumptions table
- A physical risk register with inherent and residual ratings
- A register of adaptation measures
- Estimates of financial effects
- The paragraph 29(c) metric
- A basis of preparation, draft text and an evidence log
You need
- A list of your sites with postcodes or coordinates
- Values, revenue and staff for each site
- A list of your key suppliers and the infrastructure that you depend on
- Excel, LibreOffice Calc or Google Sheets
- About 3 to 6 days of work for 10 to 50 sites
Download first
- Physical risk workbook (XLSX)
- Site register template (CSV)
- Supplier template (CSV)
- All data downloads
Part D tells you how to use these files.
How to read the labels
This guide uses four labels. They show which text is a requirement and which text is a method choice.
- Required A requirement of AASB S2 or the Corporations Act 2001, with the paragraph or section.
- Recommended Good practice or external guidance, for example from DCCEEW, ASIC, the AASB educational material or the IPCC. It is not a requirement.
- Your choice A method decision that your entity makes, records and explains.
- ClimMate method A choice that ClimMate made for the data, the workbook or the examples, or an instruction for a ClimMate tool. It is not an AASB definition. You decide if it suits your entity.
Read this first. This guide is not legal, accounting or assurance advice. ClimMate gives data, analysis and example methods to support your own assessment. The workbook thresholds, the vulnerability rule, the postcode aggregation, the formulas, the scenario mapping and the proxy calculations are ClimMate methods, unless this guide says that they are external requirements. Your entity decides if they are suitable, makes the judgements and is responsible for its disclosures. Speak to your auditor early.
What AASB S2 and the Act require for physical risk
Some requirements come from the standard (AASB S2). Other requirements come from the law (Corporations Act 2001). Keep them separate in your method and your report. AASB S2 requires material information only (Appendix D, paras [D]17–19). Your materiality assessment decides what you disclose.
| Requirement | Source | Where in this guide |
|---|---|---|
| Describe the climate-related risks that can affect your prospects, and say if each is a physical or a transition risk | Required AASB S2 paras 10(a)–(b) | Steps 2, 6 |
| Say over which horizon each effect can occur, and how you define short, medium and long term | Required AASB S2 paras 10(c)–(d) | Step 3 |
| Describe the effects on your business model and value chain, and on your strategy and decisions | Required AASB S2 paras 13–14 | Steps 2, 6 |
| Disclose the current and anticipated financial effects | Required AASB S2 paras 15–21 | Step 7 |
| Assess your climate resilience with climate-related scenario analysis | Required AASB S2 para 22; application guidance paras B1–B18 | Steps 3, 9 |
| Use at least two scenarios: one with 1.5 °C of warming, and one with warming well more than 2 °C | Required Corporations Act 2001 s 296D, for entities that must prepare a sustainability report. This is not in AASB S2. | Step 3 |
| Disclose the process to identify, assess, prioritise and monitor the risks | Required AASB S2 para 25 | Step 6 |
| Disclose the amount and percentage of assets or business activities vulnerable to physical risks | Required AASB S2 para 29(c) | Step 8 |
| Get assurance on the sustainability report, in phases | Required Corporations Act 2001; ASSA 5010 | Step 10 |
AASB S2 does not give the number of scenarios or the temperature outcomes. The Act does, for entities in the regime. ASIC RG 280 explains how ASIC applies the regime. For a limited period, statements about scenario analysis have modified liability (s 1707D): in most cases only ASIC can take action about them. Read the current Act, AASB S2 and RG 280 to find the dates that apply to you.
Step 1
Check that you must report
Required Entities that prepare financial reports under Chapter 2M of the Corporations Act 2001 must prepare a sustainability report when they meet the size tests. The report must apply AASB S2. ASIC administers the regime.
- Find your consolidated revenue, consolidated gross assets and number of employees at the end of the year.
- Compare them with the table. You are in a group when you meet at least two of the three tests.
- Check if you are in the regime for a different reason, for example as a registered NGER reporter or an asset owner.
| Group | Financial years that start on or after | Consolidated revenue | Consolidated gross assets | Employees |
|---|---|---|---|---|
| Group 1 | 1 January 2025 | A$500 million or more | A$1 billion or more | 500 or more |
| Group 2 | 1 July 2026 | A$200 million or more | A$500 million or more | 250 or more |
| Group 3 | 1 July 2027 | A$50 million or more | A$25 million or more | 100 or more |
Source: Corporations Act 2001 Chapter 2M and its transitional provisions, and ASIC RG 280 (31 March 2025), as at 13 November 2026. The dates are the start of the first reporting period, not the date to lodge the report. The Government is consulting on higher thresholds for large proprietary companies. At this date, they are a proposal only (see the RG 280 page). Confirm your obligations for each financial year with the current Act, regulations and RG 280.
Example. Example Cold Chain Pty Ltd has revenue of A$260 million, gross assets of A$410 million and 640 employees. It meets two Group 2 tests (revenue and employees). Its first reporting period starts on 1 July 2026.
Step 2 · Part B: Assessment method
Set the boundary and collect your data
The climate data is the same for all entities. Your own data makes the assessment specific to your business. First decide what is in the assessment.
Your choice The boundary follows your circumstances and your material risks (AASB S2 paras 13 and 22). You do not have to assess every asset and supplier in the same detail. Consider:
- Sites that you own, sites that you lease, and sites that other parties operate for you
- Upstream: critical suppliers, and suppliers that you cannot easily replace
- Downstream: customers and markets that give a large part of your revenue
- Infrastructure that you depend on: power, water, transport routes and ports, and telecommunications
- Concentrations: a large part of revenue, cost or assets in one region or at one site
For each site and key supplier, collect:
- A location: the postcode, and the latitude and longitude if you can. Coordinates give better results (step 4).
- The building value, contents value, annual revenue and staff.
- Data that shows how the activity depends on the climate, for example cooling electricity, outdoor work or water use.
- If it is owned or leased, and if it is critical.
Record the boundary, and what is out of it and why. This goes in your basis of preparation (step 9).
| SiteID | SiteName | Postcode | Latitude | Longitude | BuildingValue_AUD | AnnualRevenue_AUD | Employees | CoolingElectricity_MWh | CriticalSite |
|---|---|---|---|---|---|---|---|---|---|
| S01 | Brisbane distribution centre | 4110 | -27.640 | 153.000 | 42,000,000 | 48,000,000 | 95 | 5,200 | Y |
| S03 | Cairns depot | 4870 | -16.940 | 145.760 | 12,000,000 | 12,500,000 | 30 | 2,300 | N |
| S04 | Lismore depot | 2480 | -28.820 | 153.270 | 9,000,000 | 9,000,000 | 22 | 900 | N |
| S11 | Darwin depot | 0828 | -12.440 | 130.920 | 9,000,000 | 6,500,000 | 18 | 1,900 | N |
Step 3
Select the scenarios and time horizons
Required AASB S2 paragraph 22 requires climate-related scenario analysis to assess your climate resilience. Paragraph 22(b) requires you to disclose the scenarios and their sources, the time horizons, the key assumptions and when you did the analysis. For entities in the regime, the Corporations Act 2001 (s 296D) also requires at least two scenarios: one with 1.5 °C of global warming, and one with warming well more than 2 °C.
Your choice Select scenarios that suit your material exposures, your locations, your sector, and your skills and resources (AASB S2 paras B1–B18). For each scenario, record its purpose (physical effects, transition, or overall resilience), source, main assumptions, warming, horizons and dataset.
The physical risk scenarios
ClimMate method ClimMate describes each scenario by its global warming level. The pathway (SSP) is only the source of the data.
| Scenario in your report | Purpose | 2030 | 2050 | 2090 |
|---|---|---|---|---|
| 1.5 °C scenario (s 296D) | Physical effects if warming stays at 1.5 °C | 1.5 °C | 1.5 °C | 1.5 °C |
| High scenario, well more than 2 °C (s 296D) | Physical effects with high warming (a stress test) | 1.5–1.6 °C | 2.4 °C (SSP5-8.5) | 3.6 °C (SSP3-7.0) |
| 1.5 °C sensitivity (optional) | The effect of a small overshoot above 1.5 °C | – | 1.7 °C (SSP1-2.6) | 1.8 °C (SSP1-2.6) |
Warming values are IPCC AR6 best estimates relative to 1850–1900, for 20-year windows (IPCC AR6 WGI Table SPM.1). The climate data is the ClimMate ensemble, dataset ens-2026-10, with a 1995–2014 baseline.
Why these choices
- 1.5 °C scenario. No pathway that holds warming at 1.5 °C has the daily data that downscaling needs. (The IPCC 1.5 °C pathway, SSP1-1.9, does not.) Thus ClimMate gives the climate at 1.5 °C of warming (2021–2040, 19 model chains) and uses it at all horizons. This assumes that warming stays at 1.5 °C after 2040. Record this assumption.
- SSP1-2.6 is a proxy, not a guarantee. Recommended The DCCEEW National Climate Scenario Guidance (2026) names SSP1-2.6 as an option for a 1.5 °C scenario, because more data is available for it. But its best-estimate warming is 1.7 °C by 2050 and 1.8 °C by 2090. Do not say that SSP1-2.6 gives 1.5 °C for the full century. In ClimMate, SSP1-2.6 has only 3 model chains, so the workbook does not rate extreme rain with it.
- High scenario. Before 2040, all pathways give similar warming, so no pathway is well more than 2 °C at 2030. For 2050, SSP5-8.5 (2.4 °C, 19 chains) is clearly more than 2 °C. SSP3-7.0 is only about 2.1 °C at 2050 and has 6 chains. For 2090, SSP3-7.0 gives 3.6 °C. The DCCEEW guidance names SSP3-7.0 for high warming. SSP5-8.5 at 2090 (about 4.4 °C) is a possible stronger stress test.
- Labels are not proof. A pathway name alone does not show that a scenario meets the 1.5 °C or the "well more than 2 °C" condition. Record the warming level, the date, the reference period and the source.
Map the projection years to your horizons
The years 2030, 2050 and 2090 are the years of the climate data. They are not required horizons. Required You set your own short, medium and long horizons and explain how they link to your planning horizons (AASB S2 para 10(d)).
- Select your horizons from your business plans, investment cycles, asset lives and leases.
- Put each horizon next to the nearest projection year. For example, a medium horizon of 2040 can use the 2030 data with a note, or the 2030 and 2050 data as a range.
- Record the assumptions of the analysis: the source, the variable, the value or trajectory, the horizon, why you used it and its limitation. Paragraph 22(b)(ii) lists the types: climate policies, macroeconomic trends, national or regional variables, energy use and mix, and technology. Disclose the key assumptions. Keep the others in your working papers.
Other scenario sources and how to combine them
Recommended No source is mandatory. You can use sources separately or together, for the question that you want to answer.
| Source | What it is | Use it for | Version to record |
|---|---|---|---|
| SSPs (IPCC) | Shared socioeconomic pathways: emissions and forcing paths, with population, economic and land-use assumptions. They drive the climate projections. | Physical climate data; also broad socioeconomic assumptions. They are not only for physical risk. | IPCC AR6 (2021) |
| NGFS scenarios | Paths for climate, energy, economy and policy. Families: orderly (for example Net Zero 2050), disorderly (for example Delayed Transition), and hot house world (for example Current Policies). | Transition policy, carbon prices, technology, energy and macroeconomic variables, and physical damage estimates. They cover transition and physical risk, with different emphasis. | Long-term scenarios Phase V (November 2024). In November 2025, NGFS gave a notice about the Phase V physical damage estimates. Phase VI is expected in 2026. Check the portal. |
| AEMO ISP and IASR | Australian electricity: generation, demand, transmission, storage, electrification, prices and reliability. | Energy-related exposures, for example electricity cost and supply. It is not a full economy-wide climate scenario. | 2026 Integrated System Plan (June 2026) and the 2025 Inputs, Assumptions and Scenarios Report |
| DCCEEW | National Climate Scenario Guidance and the National Climate Risk Assessment. | Australian help to select pathways, warming levels, data, horizons and hazards, and to treat uncertainty. | Guidance: 2026 (final). Risk assessment: September 2025. |
| CSIRO and the Bureau of Meteorology | Climate Change in Australia projections and the Australian Climate Service. | Regional temperature, rain, extremes, coastal hazards and regional variability. Compare them with the ClimMate values (step 5). | The version on the website on the date that you use it |
When you combine sources:
- Record why you combine them.
- Check that their assumptions are approximately consistent, and compare their warming outcomes and horizons.
- Say which differences are intentional stress tests.
- Do not use an SSP name and an NGFS name as if they are the same thing. For example, NGFS Current Policies and SSP3-7.0 have different assumptions.
- Exact alignment is often not possible. This is acceptable when you record it openly.
Step 4
Get the climate data for each site
For each site and supplier, you need the hazard indicators for the baseline and for each warming level: heat, cooling demand, extreme rain, river and coastal flood, fire weather and drought.
- Coordinates are better than postcodes. ClimMate method A site with coordinates gets the value of its own 25 km grid cell. A postcode value is the mean of the grid cells of the postcode, weighted by dwellings.
- When a postcode is not enough. Large rural postcodes, sites near the coast or a river, and critical sites need coordinates. For flood, coastal and bushfire hazards at these sites, also use a site hazard study.
- A projection is not an impact model. Climate data gives the climate of a region. It is not a flood, bushfire or heat-stress model of a building.
Step 5
Check the data and the uncertainty
Reviewers and auditors will ask about uncertainty. There are four types. Record each type that is important for your results (AASB S2 para 22(a)(ii) asks for the significant areas of uncertainty).
- Scenario uncertainty. Nobody knows which emissions pathway will occur. This is why you use more than one scenario.
- Model uncertainty. Different climate models give different results for the same scenario. An ensemble of models shows this range. ClimMate gives the median and the 10th to 90th percentile of the model chains.
- Natural variability. Weather changes from year to year. Rare events (for example a 1-in-100-year rain) have a wide range.
- Data and method uncertainty. Downscaling, the 25 km resolution, the baseline period (1995–2014), no bias correction, and the flood and bushfire models all add uncertainty.
A central value (the median) tells only part of the story. Report the range too. If the model chains disagree on the direction of change, write that the direction is uncertain. This does not mean that there is no risk. A wide range can include large increases.
Recommended Compare the ClimMate values for your main regions with the CSIRO and Bureau of Meteorology projections (Climate Change in Australia). If they are very different, record why.
Step 6
Rate the risks
A high hazard is not always a high risk. The risk to your entity depends on the hazard, on what is exposed, on how vulnerable it is, and on the consequence. The glossary defines these terms.
Example. Two sites have the same river flood hazard. Site A is a cold store. Its stock and plant are at ground level, and it supplies 40 % of the revenue. Site B is a small depot with a raised floor and a second depot 20 km away. Site A has a high vulnerability and a large consequence. Site B has a low vulnerability and a small consequence. The same hazard gives two different risks.
Inherent and residual ratings
- Set the medium and high levels of each hazard indicator. Record why.
- Set the vulnerability of each site to each hazard (low, normal or high). For example, a cold store is more vulnerable to heat than an office. Record why.
- Rate the inherent risk: the risk before your controls and adaptation.
- Record the existing controls and adaptation. Include only measures that are in place now and that you have evidence for.
- Rate the residual risk: the risk after the existing measures. Do not count a measure two times, for example in the vulnerability and in the residual rating.
- Get management approval for the thresholds, the vulnerability ratings and the residual ratings.
Record the adaptation measures
Recommended Keep one register of the measures that change your vulnerability (AASB S2 paras 14, 22 and 25). Keep two types separate: operational controls (for example a flood plan, moving stock, backup power) and strategic adaptation (for example raising a building, moving a site, more cooling plant).
| Record for each measure | Why |
|---|---|
| Status: in place, planned or proposed | Only measures in place change the residual rating |
| Evidence that it works | For example a test, an inspection or a past event |
| Cost and timing | For the financial effects (step 7) and capital deployment (para 29(e)) |
| Residual risk after the measure | Shows how much the measure decreases the risk |
| Dependencies and funding | For example landlord approval, council approval, a budget that the board approved |
Check that each planned measure is realistic and has the money and people that it needs. A planned measure does not decrease the residual rating until it is in place.
Decide which risks are material
Your choice A modelled hazard is an input to risk identification. It is not a material risk by itself. Think about the likelihood and the size of the effect on your prospects, with exposure, vulnerability, dependencies and the financial and operational consequences together (AASB S2 paras 10–14; Appendix D paras [D]17–19). Record why you screen each risk in or out. ASIC found that some entities did not identify physical risks that had already affected their assets in past extreme weather (REP 839; AASB S2 para B9). Check your past events.

Example. The Mildura packhouse (S08) has a high river flood rating at 1.5 °C and 2.4 °C, and a medium rating at 3.6 °C. Its river flood loss cost increases from 0.31 % of the building value a year at the baseline to 0.35 % at 2.4 °C. At 3.6 °C, it decreases to 0.20 %, because the Murray catchment becomes drier. At 2.4 °C, the 1-in-100-year wettest day increases by 18 %. But the model chains give a range of −39 % to +76 %. Write this range in the register.
Step 7
Estimate the financial effects
Required AASB S2 requires information about how climate-related risks affect your financial position, financial performance and cash flows: the current effects in the reporting period, and the anticipated effects in the short, medium and long term (paras 15–21). Follow each material risk through this chain:
- Hazardmore river floods at the Lismore depot
- Exposure and vulnerabilitystock at ground level; no second depot nearby
- Operational effectthe depot closes for 10 days; stock is lost
- Line itemlost revenue, repair capex, stock write-off, premium
- Financial effectan amount or a range, with the horizon and the scenario
Physical risks can affect more than cooling costs, flood damage and insurance. Think about each of these channels:
| Channel | How a physical risk gets there | In the ClimMate workbook? |
|---|---|---|
| Revenue and demand | Sites close, customers cannot get products, demand changes with the weather | No. Add it. |
| Operating costs | More cooling energy, repairs, overtime, freight around closed roads | Cooling cost (indicator) |
| Capital expenditure | Flood barriers, larger cooling plant, backup power | Adaptation sheet (your costs) |
| Asset values and useful lives | Damage, shorter useful lives, impairment of exposed assets | Expected flood damage (indicator) |
| Supply chain | Suppliers or ports stop; higher input costs | No. Use the supplier rows of the register. |
| Business interruption | Lost profit while a site is closed | No. Add it. |
| Insurance, financing and capital | Higher premiums, higher excesses, less cover, higher cost of capital, less access to finance | Premium change (indicator) |
Quantitative or qualitative
- Required You can give qualitative information instead of an amount only in the conditions of AASB S2 paragraphs 19–21, for example when the effect cannot be separately identified, or the measurement uncertainty is so high that a number is not useful. Then explain why, describe the effect in words, and name the line items that it can affect.
- Required Use the reasonable and supportable information that you can get without undue cost or effort, at the reporting date (para 18). Your skills and resources are a factor.
- Recommended ASIC found that 37.5 % of the first reports gave only qualitative information, and asks for amounts where they are reasonably measurable (REP 839, as reported by BDO). The AASB educational material Disclosing information about anticipated financial effects (October 2025) gives illustrations.
- For each effect, record the assumptions, the horizon, the scenario, the uncertainty and the conditions that are specific to your entity.
- For each effect, record if it is an indicator (a proxy that shows the size and the direction), an estimate (your best forecast of an amount) or an accounting amount (in your financial statements, for example an impairment).
- Make sure that the numbers agree with your financial statements. ASIC found weak links between the two in many first reports.

Example. The 12 sample sites use cooling electricity that costs A$5.68 million a year. At 2.4 °C, this cost can increase by about A$2.06 million a year. The expected flood damage increases from A$0.15 million to A$0.21 million a year. The flood and storm part of the insurance premium can increase by about A$0.37 million a year. These are indicators, not forecasts.
Step 8
Calculate the physical risk metric
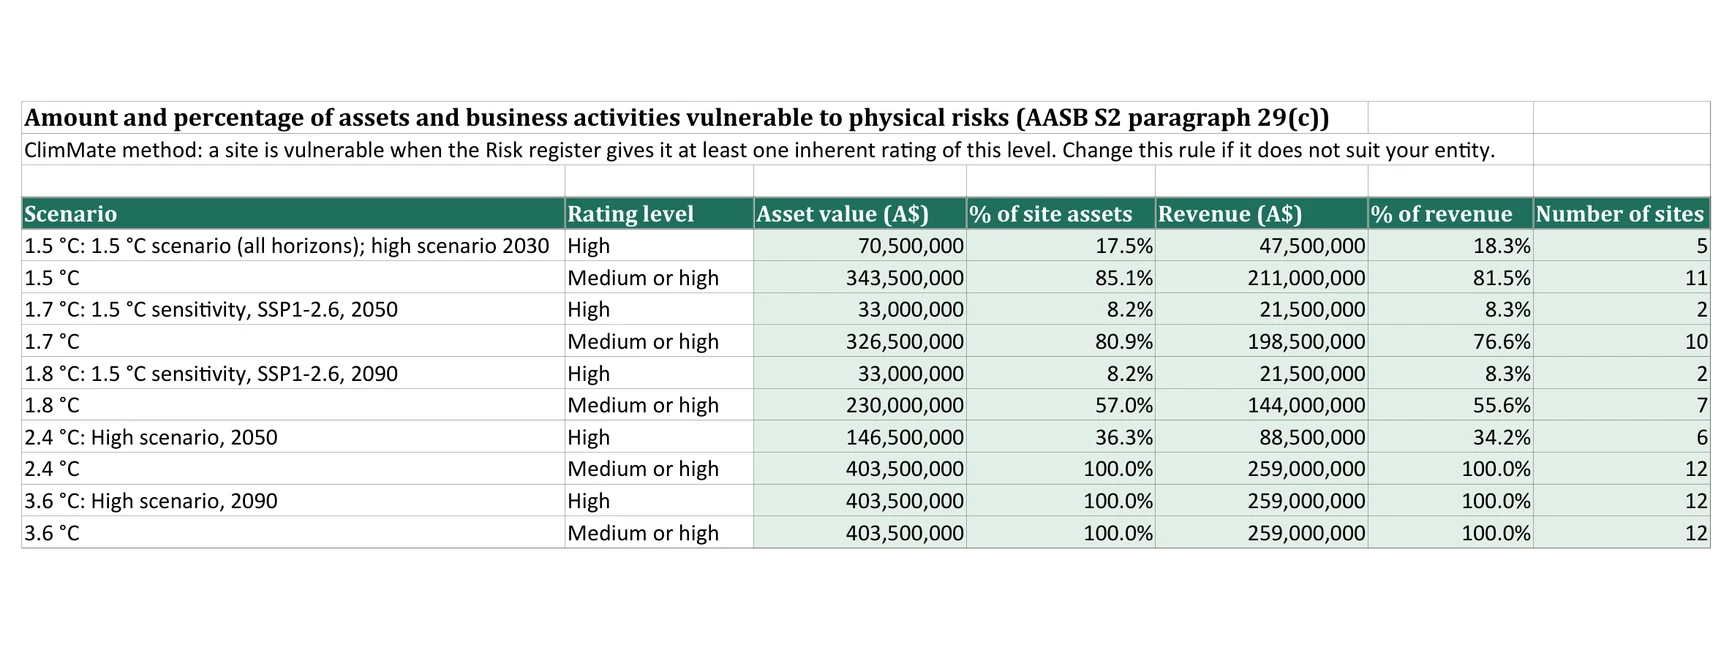
Required AASB S2 paragraph 29(c) requires the amount and percentage of assets or business activities vulnerable to climate-related physical risks. AASB S2 does not define "vulnerable". You decide the definition and disclose it.
- Define vulnerable. For example "at least one high inherent rating", or "at least one high residual rating". Record it.
- Set the numerator and the denominator. The numerator is the value of the vulnerable assets or activities. The denominator is the value of all assets or activities in the boundary. If the denominator is not your total assets or revenue, say so.
- Set the boundary. State if leased sites are in, and if supplier and other value-chain activities are out.
- Set the valuation basis. For example replacement value or carrying amount. Use one basis for all sites.
- Measure business activities. For example revenue, staff, production or contribution margin at each site.
- Aggregate without double counting. A site with more than one high hazard counts one time.
- Give the scenario and horizon. Report the metric for each scenario and horizon that you use.
- Record data gaps and disclose the method. For example sites without coordinates or values. Disclose the definition, boundary and basis with the metric.
Step 9 · Part C: Interpretation and disclosure
Interpret the results and write the disclosure
Keep three things separate
- The public disclosure. The material information that AASB S2 requires, in your sustainability report.
- The basis of preparation. A document that explains the purpose, scope, boundary, organisational context, scenarios, assumptions, horizons, datasets, models, aggregation, risk method, financial effects method, limitations, judgements, changes from the last period and approvals. Put a summary of the material parts in the report.
- The working papers and evidence. Raw data, calculations, model outputs, checks and approvals (step 10). Most of it does not go in the report.
Do not leave required material information out of the report because it is in the basis of preparation or the working papers. ASIC also says that disclaimers that conflict with the statutory framework are not permitted (REP 839).
Climate resilience is more than a hazard map
Required A hazard map or a risk score is not a resilience assessment. AASB S2 paragraph 22(a) asks for the implications for your strategy and business model, the significant areas of uncertainty, and your capacity to adjust or adapt in the short, medium and long term. Capacity includes your financial resources, your ability to redeploy, repurpose, upgrade or decommission assets, and your current and planned investments. Physical risk is only one input. The full guide adds transition risk. Disclose the anticipated financial effects (paras 15–21) and the resilience assessment (para 22) separately. ASIC found that some first reports combined them.
Four types of statement
These four types of statement are different. Do not mix them. The text is an example for a fictional company. It is not a template for all entities.
| Type | Example text (fictional company) | Support outside the report |
|---|---|---|
| A projected hazard indicator | "At 2.4 °C of warming, our Mildura packhouse has about 15 more hot days a year than the 22 of the recent climate (range of the models: 11 to 20)." | ClimMate data, checksum, model range |
| An identified physical risk | "River flood at our Mildura packhouse is a material risk. Its inherent rating is high in both scenarios to 2050." | Risk register, thresholds, vulnerability reasons |
| An anticipated financial effect | "At 2.4 °C, the cooling electricity cost of our sites can increase by about A$2.1 million a year." | Financial effects sheet, assumptions |
| A climate resilience conclusion | "We can manage the physical risks to 2050 in both scenarios with the planned flood works at two sites. Above 2.4 °C, cooling costs at our northern sites are a strategic risk that we will review in our 2028 network plan." | Board papers, adaptation register, funding |
At 1.5 °C of warming (1.5 °C scenario), 17 % of our site assets (A$70.5 million) and 18 % of our revenue are at sites with a high physical risk. At 2.4 °C of warming (2050, high scenario), 36 % of our site assets (A$146.5 million) and 34 % of our revenue are at sites with a high physical risk.
Connect the outputs to AASB S2
This table connects the physical risk outputs to the parts of AASB S2. An output does not complete a requirement by itself. You must still decide what is material and write text that is true for your business.
| AASB S2 paragraph | What to disclose | Status | Output of this guide |
|---|---|---|---|
| 6–7 Governance | How the board and management oversee physical risk | Required (all climate risks) | Board papers that present the results. The rest: full guide |
| 10–11 Strategy | The physical risks (acute or chronic) and the horizons | Required if material | Risk register, horizons (steps 3, 6) |
| 13–14 Strategy | Effects on the business model, value chain, strategy and decisions, including adaptation | Required if material | Supplier rows, adaptation register (steps 2, 6) |
| 15–21 Strategy | Current and anticipated financial effects | Required if material | Financial effects and your own estimates (step 7) |
| 22 Strategy | Climate resilience and the scenario analysis | Required | Scenario table, assumptions, physical part of the resilience conclusion (steps 3, 9) |
| 25 Risk management | The process to identify, assess, prioritise and monitor the risks | Required | This method, thresholds, basis of preparation (step 6) |
| 29(c) Metrics | Assets and business activities vulnerable to physical risks | Required | The metric and its definition (step 8) |
| 29(e), 33–36 Metrics and targets | Capital for adaptation; adaptation targets, if you have them | May be material | Adaptation register (step 6) |
| – | Extra detail, for example maps or site lists | Optional | Explore, risk register |
Step 10
Keep the evidence for assurance
An assurance practitioner must be able to follow each number back to its source and each method back to a decision. The evidence supports the reported information and the method. Most of it does not go in the report. Keep:
- The source data and downloads, unchanged, with the access dates and checksums.
- The dataset, model and scenario versions.
- The site register, and how you got the coordinates of each site (geocoding).
- The calculation workbook, with formulas (not values), and a record of who checked the formulas.
- The validation, for example a comparison with past floods or with council flood studies.
- The assumptions and the management judgements, with the reasons.
- The review records and the approvals of the scenarios, thresholds, vulnerability ratings and results.
- A change log: data, method, sites or thresholds that changed from the last period.
Required Assurance on sustainability reports is phased in under ASSA 5010 (as amended by ASSA 2025-10). The scope and level (limited or reasonable) change with the year of reporting, the group and the type of disclosure. In the AUASB phasing, scenario analysis and climate resilience have no assurance in year 1, limited assurance in years 2 and 3, and reasonable assurance after that. Check the current ASSA 5010 and ASIC guidance for your entity and your periods.
Part D · Use the ClimMate tools
D1. Get the data for your sites
ClimMate tool This part tells you how to use the ClimMate tools. It is separate from the AASB S2 requirements in Parts A to C. Use method A for most sites. Use method B if you cannot upload files to a website. The two methods give the same values.
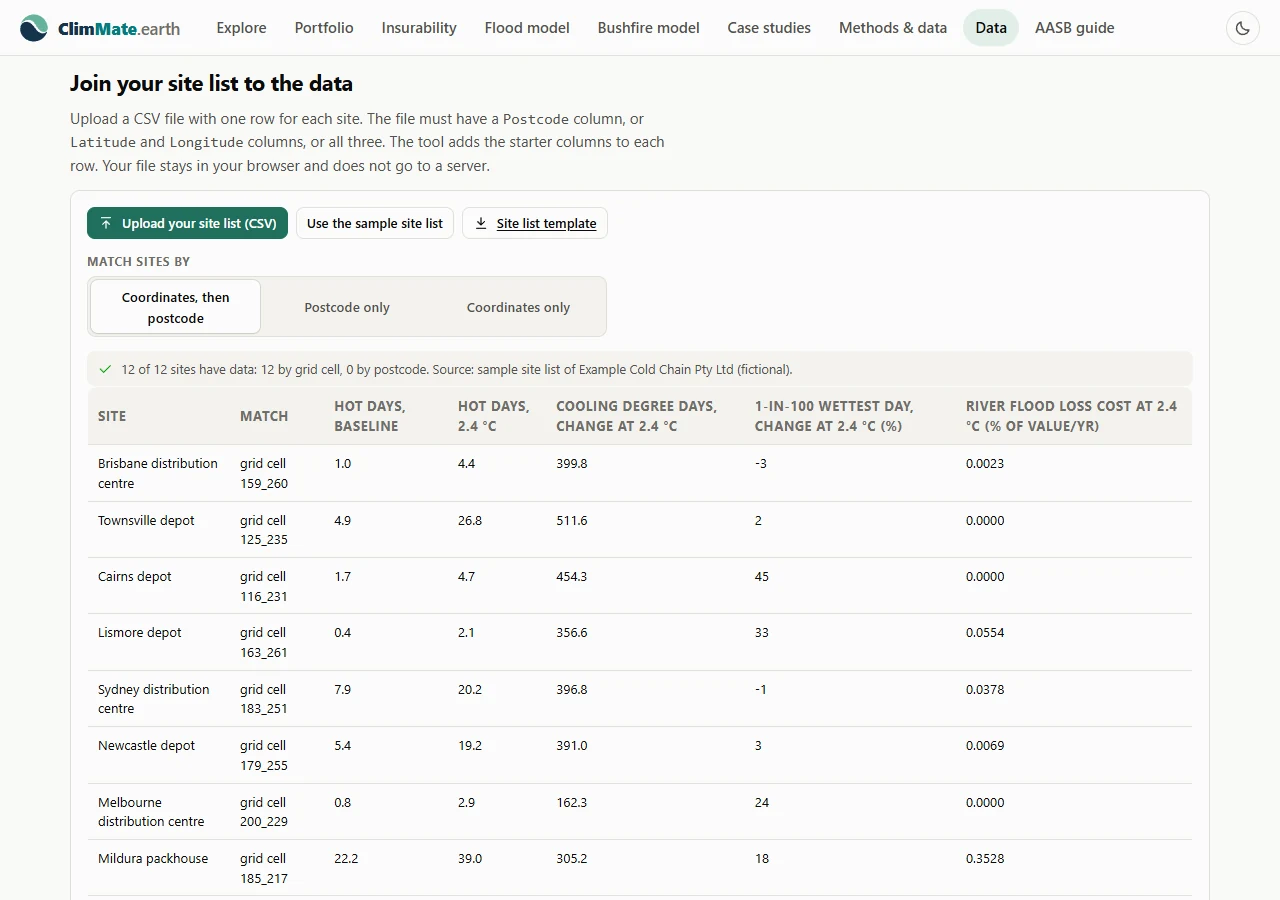
Method A: the join tool
- Open the Data page.
- Click Upload your site list (CSV). Select your site register file.
- Make sure that Coordinates, then postcode is selected.
- Read the message. Make sure that all sites have data.
- Click Download the joined file (CSV).
- Open the joined file. Copy all rows to the ClimMate data sheet of the workbook.
Method B: a spreadsheet formula
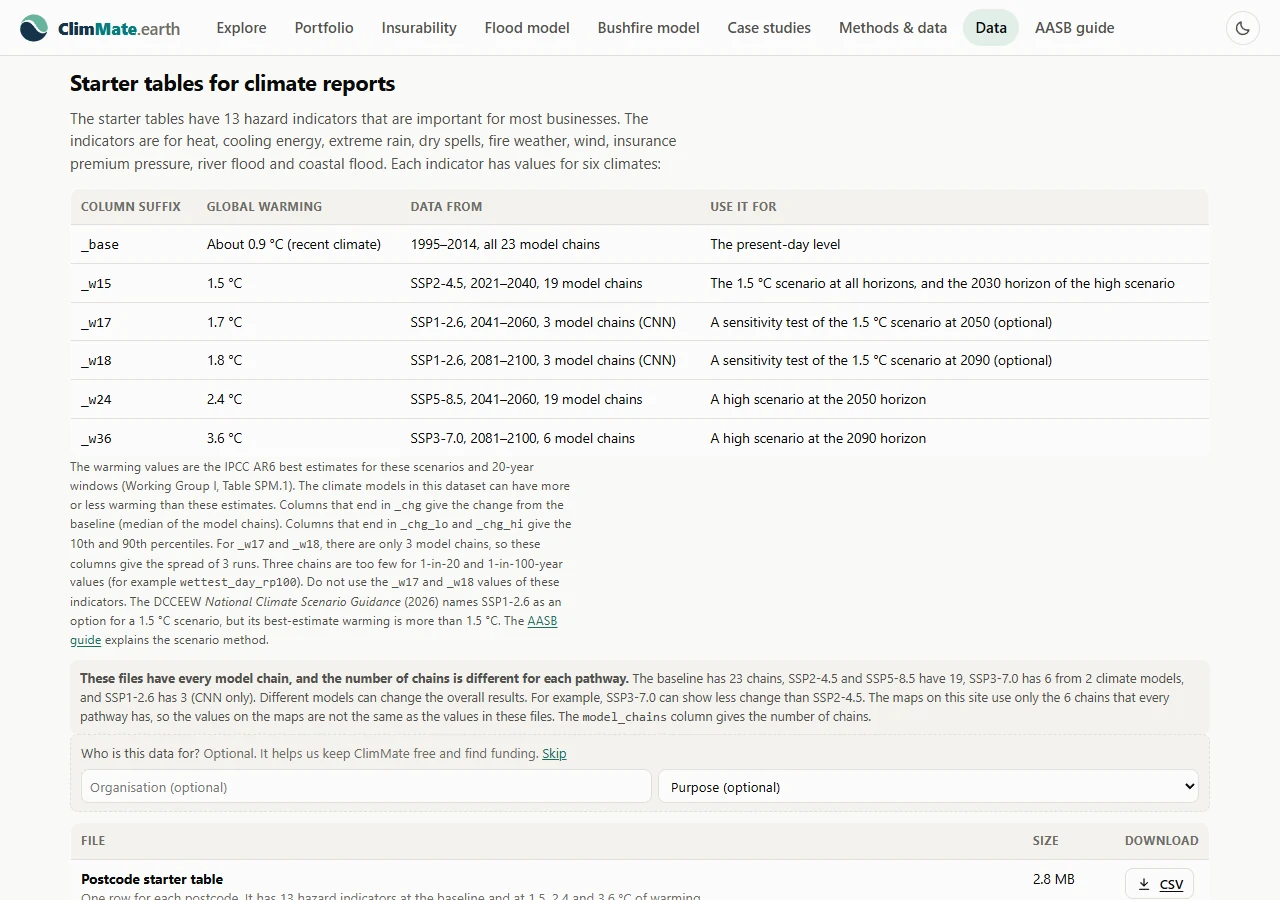
- On the Data page, download the Postcode starter table.
- Open it in Excel. Copy the table to a new sheet with the name
Postcodes. - On your site sheet, type this formula to get one column (here, hot days at 2.4 °C):
=XLOOKUP(TEXT(F2,"0000"), Postcodes!$A:$A, XLOOKUP("hot_days_w24", Postcodes!$1:$1, Postcodes!$A:$ZZ))
Cell F2 has the postcode of the site. Copy the formula down and across for each column that you need. The column dictionary gives the meaning of each column. XLOOKUP needs Excel 2021, Microsoft 365, LibreOffice 24.8 or Google Sheets. In older versions, use INDEX and MATCH.
See the model range on Explore
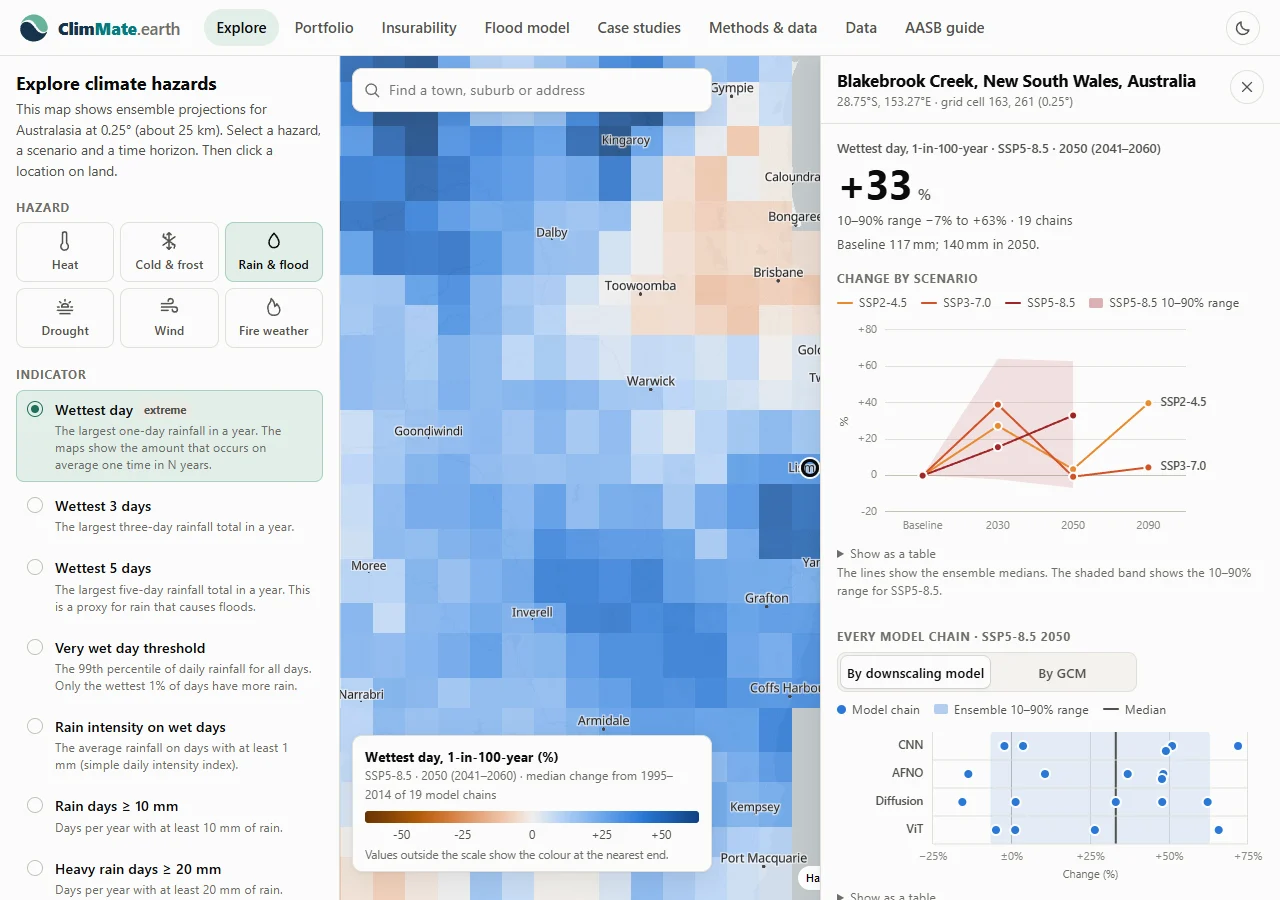
- Open Explore. Type the suburb of a site in the search box. Select the result.
- Select a hazard and an indicator, for example Rain & flood and Wettest day.
- Select the warming pathway and the horizon, for example Very high (SSP5-8.5) and 2050.
- Look at the dots for each model chain in the panel.
- For your values, use the download files. They have every model chain. Explore uses only the 6 chains that the Medium, High and Very high pathways have (2 for Low), so its values can be different.
D2. Workbook manual
ClimMate tool The physical risk workbook has the sample data of a fictional company. Replace the yellow cells with your data. Green cells are formulas: do not type in them.
The sheets
| Sheet | Purpose | You type | Guide step |
|---|---|---|---|
| Read me | How to use the workbook; labels; limits | – | – |
| Scope | Reporting group and horizons | Revenue, assets, employees, horizons, premium | 1, 3 |
| Basis of preparation | Template for the basis of preparation | Your text for each section | 9 |
| Scenarios | Scenarios, warming levels and your horizons | Your horizon for each row | 3 |
| Sites, Suppliers | Registers | One row for each site or supplier | 2 |
| ClimMate data | The joined climate data | Paste the joined file | 4 |
| Thresholds | Medium and high level of each hazard | Levels and reasons | 6 |
| Risk register | Inherent ratings for each site, hazard and warming level | Vulnerability, controls, residual rating, response | 6 |
| Adaptation | Register of adaptation measures | One row for each measure | 6 |
| Financial effects | Three indicator formulas | Check the assumptions | 7 |
| AASB S2 metric | The paragraph 29(c) metric and its definition | Change the definition if needed | 8 |
| Scope 1 and 2 | Example for the full guide (emissions) | Activity data and factors | Full guide |
| Disclosure draft | Example text | Edit the words | 9 |
| Evidence log | Sources, checksums, approvals | Dates, names, approvals | 10 |
| Assumptions | Template for the scenario assumptions | Source, value, horizon, reason, limitation | 3 |
Data formats
- Files: CSV with UTF-8 encoding and one header row. Keep the column names of the templates. You can add columns.
- Postcodes: four digits. Excel removes the first zero of NT postcodes (0828 becomes 828). The join tool adds it again. In your own formulas, use
TEXT(A2,"0000"). - Coordinates: decimal degrees, latitude negative (for example −27.640, 153.000).
- Values: Australian dollars, without symbols or spaces.
- Column A of the ClimMate data sheet must be the site ID or supplier ID.
How the formulas work
- Inherent rating: Low, Medium or High from the thresholds; a "High" vulnerability moves it up one level and a "Low" vulnerability moves it down one level.
- Extra cooling cost: cooling cost now × change of cooling degree days ÷ baseline cooling degree days. Where the baseline cooling demand is very small (for example Hobart), the percentage change is very large. Check these sites.
- Expected flood damage: (building + contents value) × (river + coastal flood loss cost).
- Extra insurance premium: premium of the site × flood and storm share × change of premium pressure.
- Metric: value of sites with at least one high rating ÷ value of all sites, for each warming level.
Read the outputs
- Red cells: high ratings. Amber cells: medium ratings. Low ratings have no colour.
- Not rated: extreme rain at 1.7 °C and 1.8 °C. SSP1-2.6 has too few model chains for rare events.
- No data: the site has no ClimMate data. Check its coordinates and postcode.
Troubleshooting
- Many "No data" cells. The site IDs on the ClimMate data sheet do not agree with the Sites sheet, or the header row is missing.
- A site matched by postcode, not grid cell. The coordinates are missing or not in Australia. Check the sign of the latitude.
- Numbers do not change. Your spreadsheet does not calculate automatically. Turn on automatic calculation.
- Compatibility. The workbook uses
INDEX,MATCH,VLOOKUP,IFERRORandCHOOSE. It works in Excel 2010 and later, LibreOffice Calc and Google Sheets.
Versions and known limitations
- Workbook version: guide version 3.0 (13 November 2026). Data: ClimMate dataset ens-2026-10. The Read me sheet gives the date of the starter tables.
- When ClimMate publishes a new dataset, download the new files and paste them again. Record the change in the Evidence log.
- The thresholds, vulnerability rule and formulas are examples (ClimMate methods). The financial effects are indicators.
D3. What the ClimMate data does not cover
- Resolution. The data has a resolution of about 25 km. It shows the regional climate, not the conditions at one building.
- Baseline and reference. The baseline is 1995–2014. The warming levels are relative to 1850–1900.
- Ensemble. Machine-learning downscaling of CMIP6 global models. 23 model chains for the baseline, 19 for 1.5 °C and 2.4 °C, 6 for 3.6 °C and 3 for SSP1-2.6. The values are the median and the 10th to 90th percentile.
- Bias. The data has no bias correction. Use the change from the baseline when you can.
- Extremes. Rare events (for example the 1-in-100-year wettest day) come from a GEV fit to the 20 annual maxima of each model chain. They have a wide range.
- Aggregation. Postcode and LGA values are means of grid cells, weighted by dwellings.
- Flood depth. The flood model uses regional river and coastal flood maps. It does not know the floor level or the local drainage of your building.
- Cyclone wind and hail. The data does not show tropical cyclone gusts or hail.
- Heat. The hot-day counts use the daily mean temperature, not the daily maximum temperature.
- Projections are not impact models. Climate data is not a flood, bushfire or heat-stress model for a site. For critical sites, use a specialist hazard model.
- Other parts of AASB S2. The data does not give transition risks, opportunities, emissions, targets or governance information.
Read the full limitations. Write the important limitations in your disclosure.
Reference
Glossary
This guide uses each term with one meaning only. A hazard, a risk and an impact are different things.
- Climate-related risk
- A possible negative effect of climate change on the entity. It is a physical risk or a transition risk.
- Physical risk
- A risk from the physical effects of climate change. Acute: from events, for example floods, bushfires and heatwaves. Chronic: from long-term changes, for example higher mean temperature or sea level.
- Transition risk
- A risk from the change to a lower-carbon economy, for example policy, law, technology, markets and reputation.
- Opportunity
- A possible positive effect of climate change on the entity.
- Hazard
- A climate event or condition that can cause damage or loss, for example a 1-in-100-year rain.
- Exposure
- The people, assets and activities in a place where a hazard can occur.
- Sensitivity
- How much a hazard affects an exposed asset or activity, for example how much stock a flood of 0.5 m damages.
- Adaptive capacity
- The ability of the entity to adjust, to decrease damage or to recover, for example backup sites, finance and flexible supply.
- Vulnerability
- How easily an asset or activity is damaged or stopped. It combines sensitivity and adaptive capacity.
- Likelihood and consequence
- How probable an effect is, and how large it is for the entity. Together they give the size of a risk.
- Inherent and residual risk
- Inherent risk is the risk before controls. Residual risk is the risk after the controls that are in place now.
- Impact
- The effect of a hazard on the entity after exposure and vulnerability. A hazard is not an impact.
- Scenario
- A possible and consistent description of the future, with its assumptions. It is not a forecast.
- Pathway
- A path of emissions and socioeconomic change over time, for example an SSP. It is a source of the data for a scenario.
- Warming level
- The increase of global mean surface temperature relative to 1850–1900, for example 1.5 °C.
- Climate resilience
- The capacity of the entity to adjust to climate-related changes, developments and uncertainties (AASB S2 para 22).
- Anticipated financial effect
- An expected effect of a climate-related risk or opportunity on the financial position, performance or cash flows in the short, medium or long term.
- Reporting boundary
- The entities, sites and activities that the assessment includes.
- Model chain
- One combination of a global climate model and a downscaling model. ClimMate gives the median and the range of the chains.
Source library
Last reviewed: 13 November 2026, for all rows. Check each source for a newer version before you use it. The full guide has more sources, for the other parts of AASB S2.
Primary requirements
| Publisher | Title | Version or date | Why we use it |
|---|---|---|---|
| AASB | AASB S2 Climate-related Disclosures (compiled) | Compiled with AASB S2025-1, December 2025 | The standard that the report applies |
| AASB | AASB S2025-1 Amendments to AASB S2 | December 2025; applies from 1 January 2027 | Greenhouse gas amendments |
| Parliament of Australia | Corporations Act 2001, Chapter 2M, s 296D, s 1707D | Current compilation | The regime, the scenario requirement, modified liability |
| AUASB | ASSA 5010 and ASSA 5000 | As amended by ASSA 2025-10 | Assurance standards and phasing |
Regulator and government guidance
| Publisher | Title | Version or date | Why we use it |
|---|---|---|---|
| ASIC | RG 280 Sustainability reporting | 31 March 2025 | How ASIC applies the regime |
| ASIC | REP 839 Review of sustainability reports lodged for 31 December 2025 | 21 September 2026 | Common gaps in the first reports |
| AASB | Disclosing information about anticipated financial effects (educational material) | October 2025 | Financial effects (step 7) |
| AASB | Scenario analysis educational material (slides) | April 2026 | Scenario analysis (step 3) |
| DCCEEW | National Climate Scenario Guidance (consultation page) | Final 2026. We did not confirm the URL of the final document. Search dcceew.gov.au. | Australian scenario selection |
| Australian Climate Service, DCCEEW | National Climate Risk Assessment | 15 September 2025, with the National Adaptation Plan. Search dcceew.gov.au. | National hazards and warming levels |
Technical sources
| Publisher | Title | Version or date | Why we use it |
|---|---|---|---|
| IPCC | AR6 WGI Summary for Policymakers, Table SPM.1 | 2021 | Warming estimates of the pathways |
| CSIRO and Bureau of Meteorology | Climate Change in Australia | Website version on the date of use | Regional projections for comparison |
| NGFS | NGFS Scenarios Portal | Long-term Phase V (November 2024); Phase VI expected 2026 | Transition and physical scenarios |
| AEMO | Integrated System Plan and IASR | 2026 ISP (June 2026); 2025 IASR | Energy-sector scenarios |
| ClimMate | Methods & data | Dataset ens-2026-10 | The climate data and its limitations |
Market practice examples
| Publisher | Title | Version or date | Why we use it |
|---|---|---|---|
| KPMG | Australian sustainability reporting: illustrative disclosures | 2026 | Illustrative text for a fictional entity. It is not a real report or a requirement. |
| ASIC | REP 839 (above) | 21 September 2026 | A review of 40 real first-year reports |