

Case studies
Places with little or no home insurance
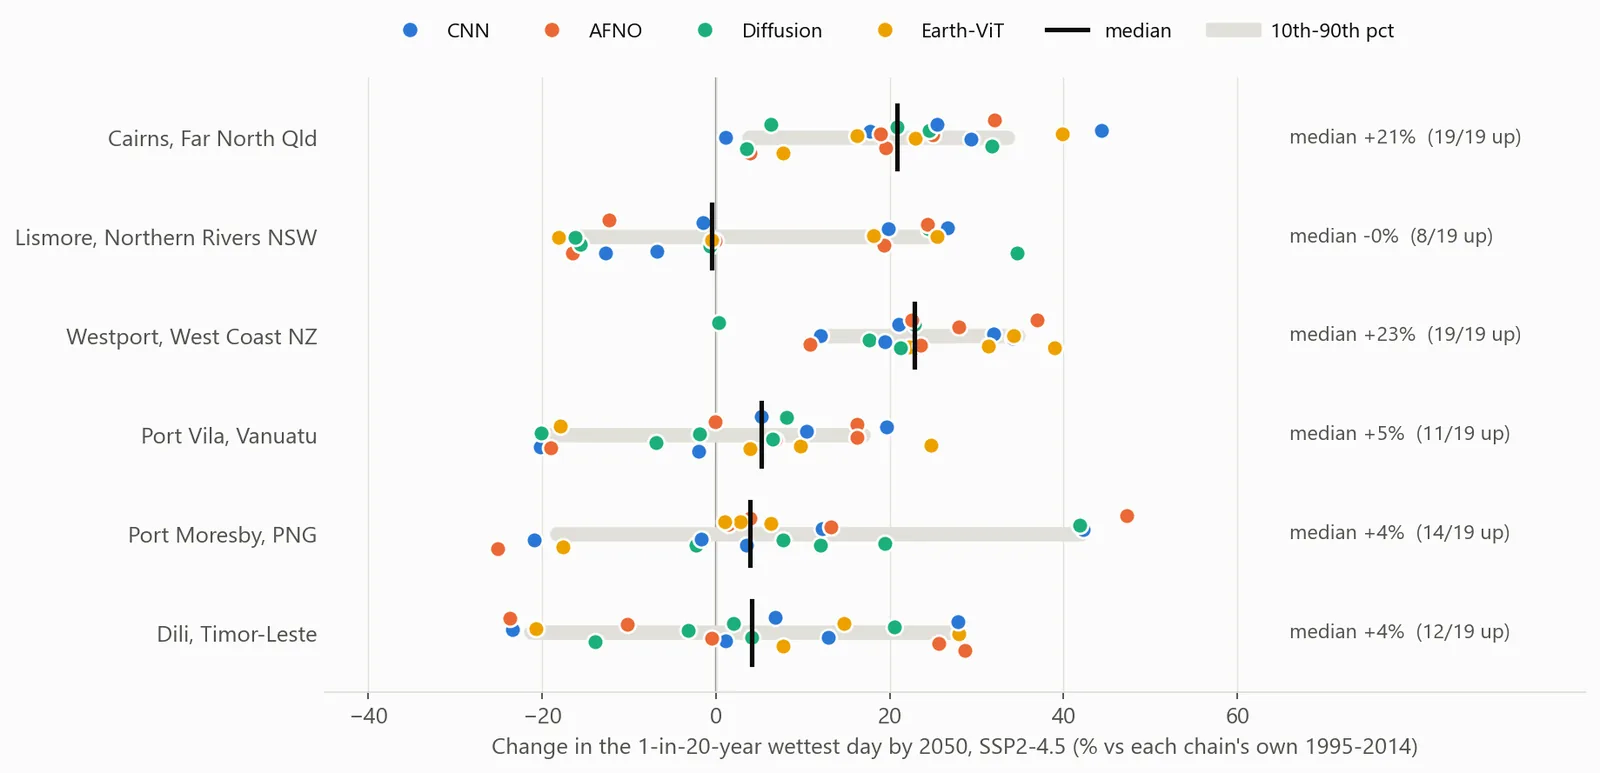
This page shows six places in Australasia and the Pacific where home insurance decreases or was never sold. For each place, we use the same 19 model chains. Each number shows the spread across these chains.
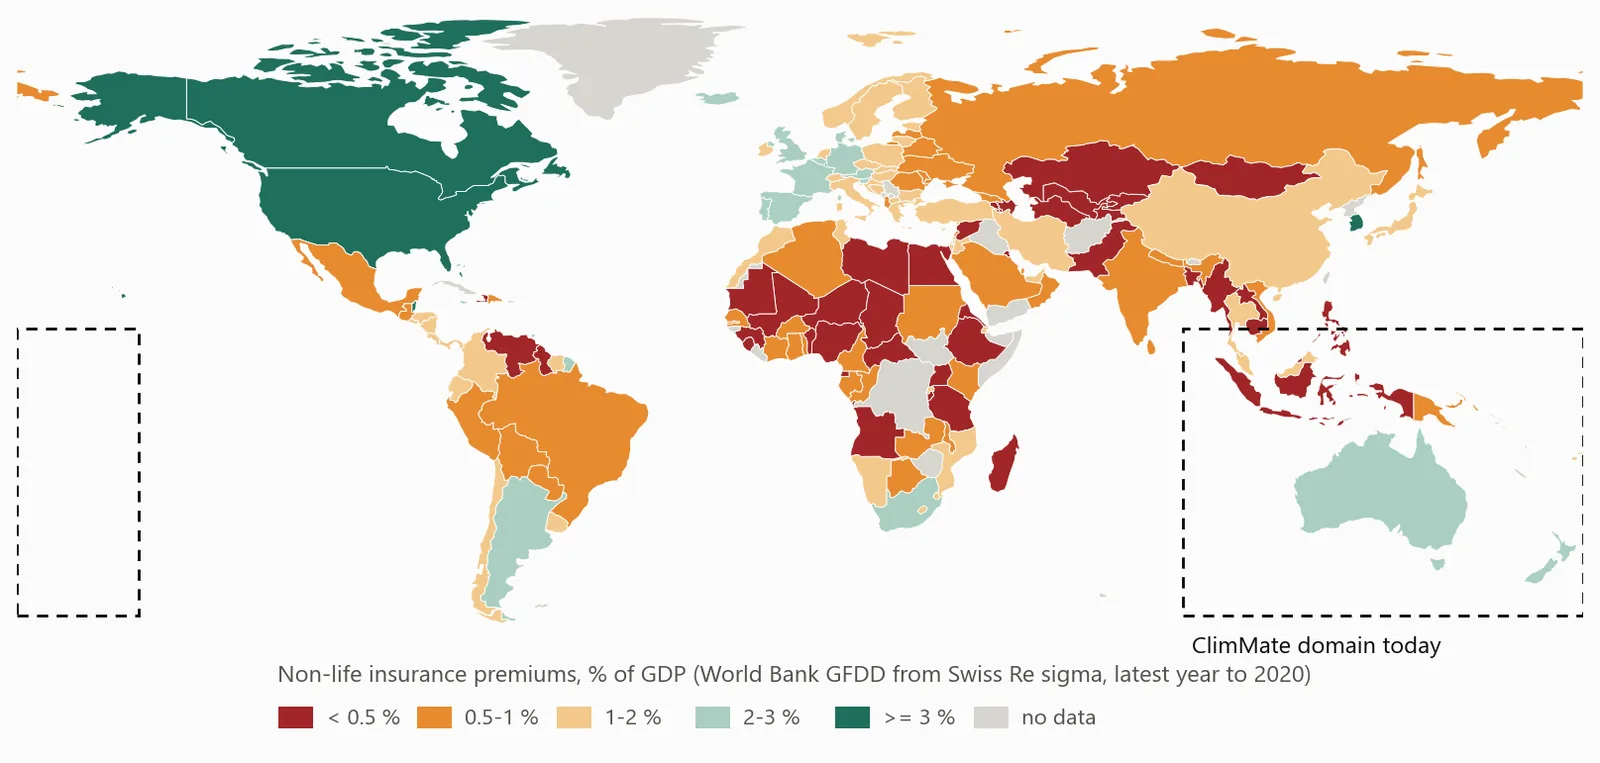
The protection gap
Insurance is lowest in places where the risk increases and where no catastrophe model exists. Grey countries have no market statistics.
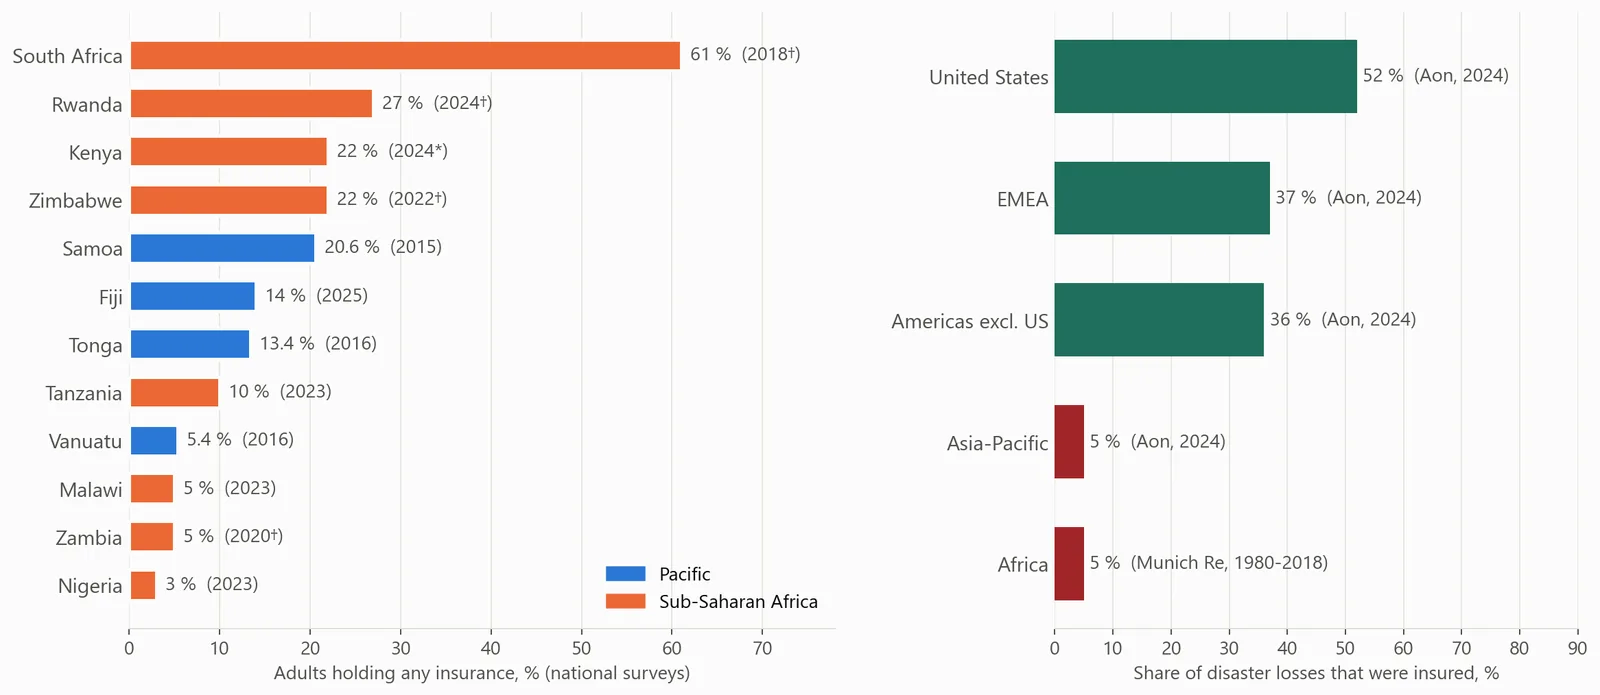
Who has insurance
Premium statistics exist only where insurance markets exist. Household surveys give data for the other places. In most of the surveyed Pacific and Sub-Saharan African countries, fewer than 1 in 7 adults have any insurance. In Africa and Asia-Pacific, insurance covered about 5 % of disaster losses.
Acute physical risk across the domain
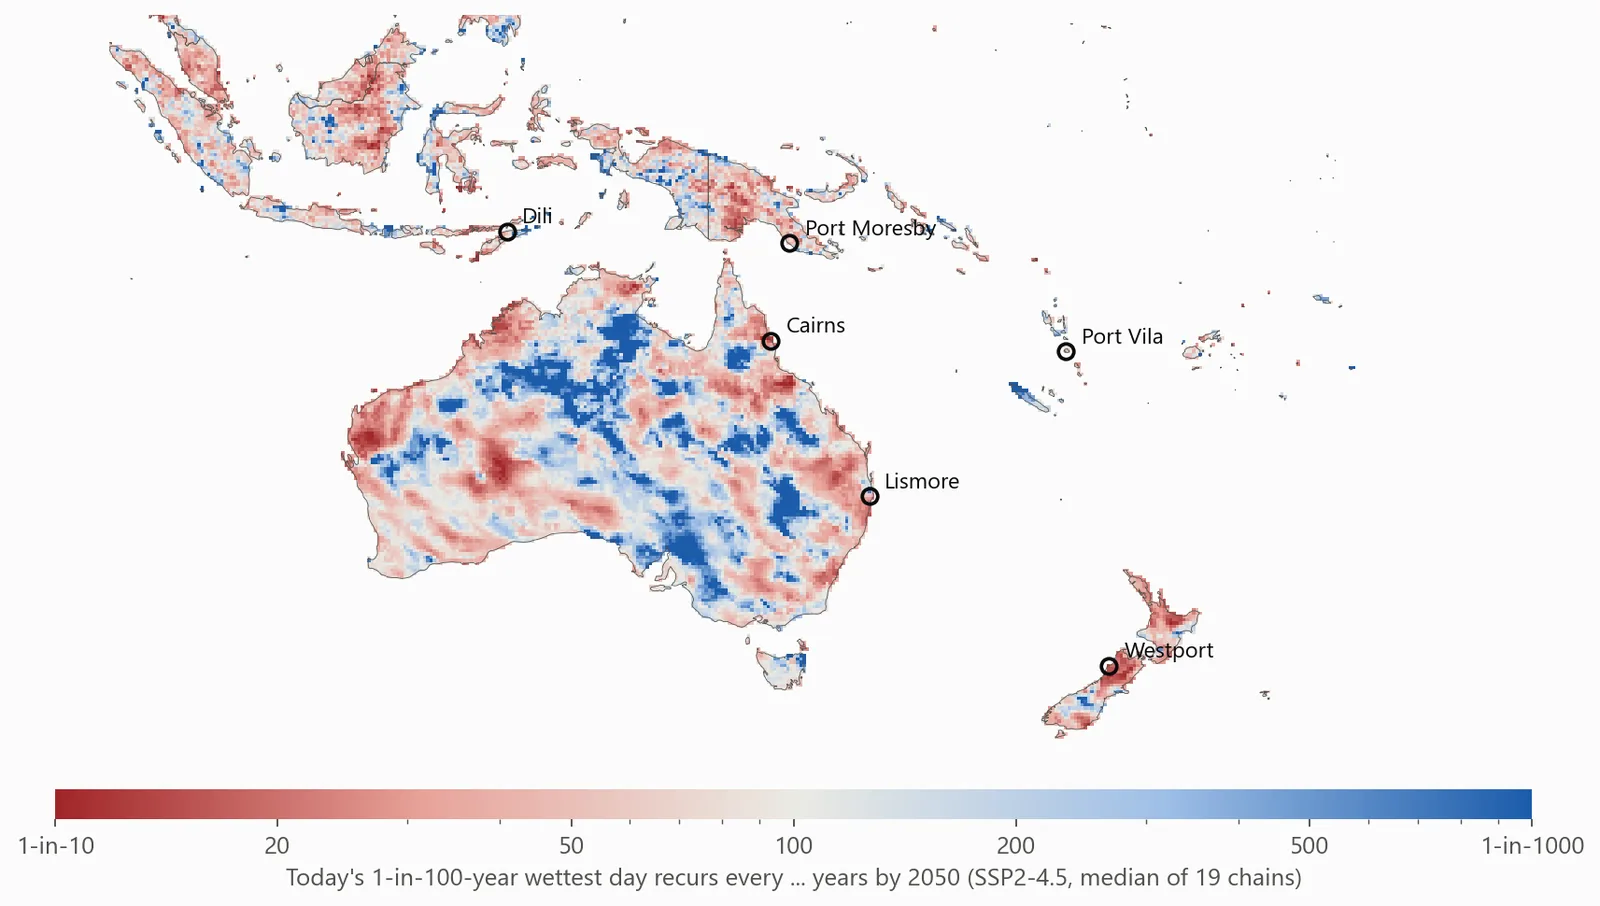
The map shows the return period in 2041–2060 of today's 1-in-100-year wettest day. Red shows that this day occurs more often.
Case 1 · Australia
Far North Queensland
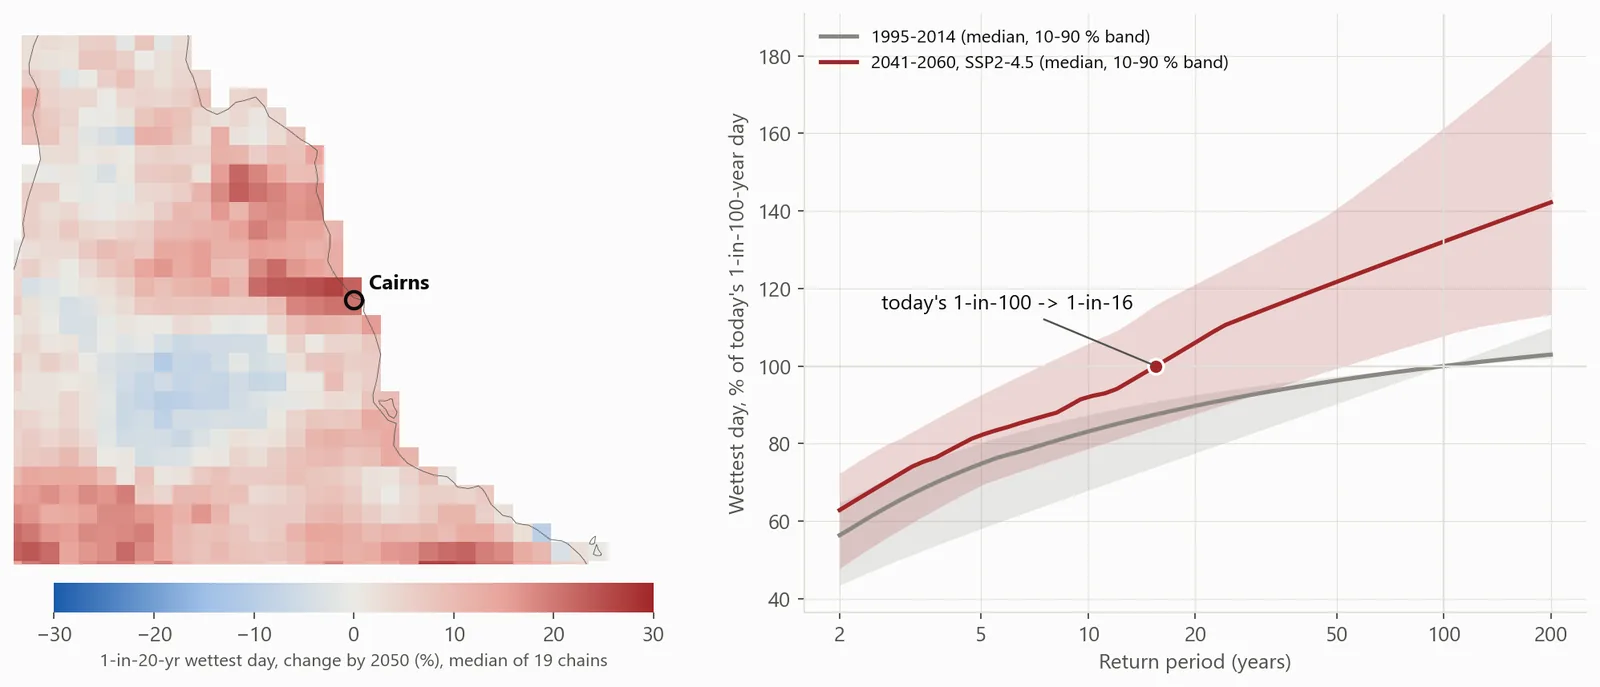
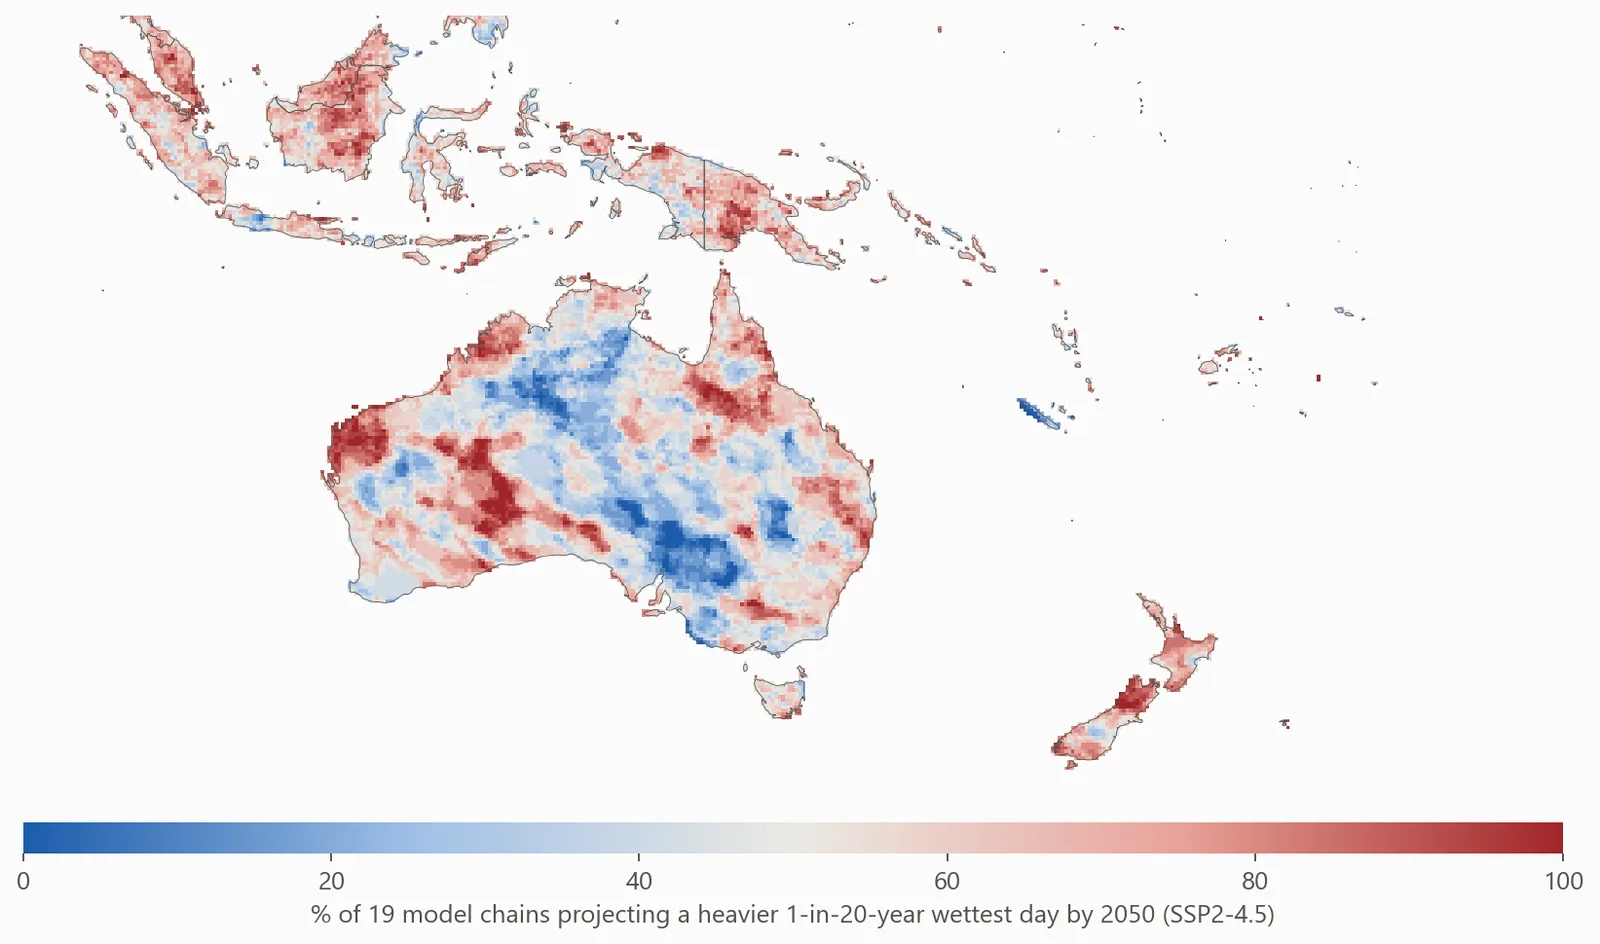
Northern Australia already has the highest premiums in the country. Its rate of homes with no insurance is two times the national rate. A federal Cyclone Reinsurance Pool started in July 2022 and continues. All chains project heavier extreme rain here. Cyclone wind and storm surge are the main perils, but they are not in this dataset at this time.
Case 2 · Australia
Northern Rivers, New South Wales
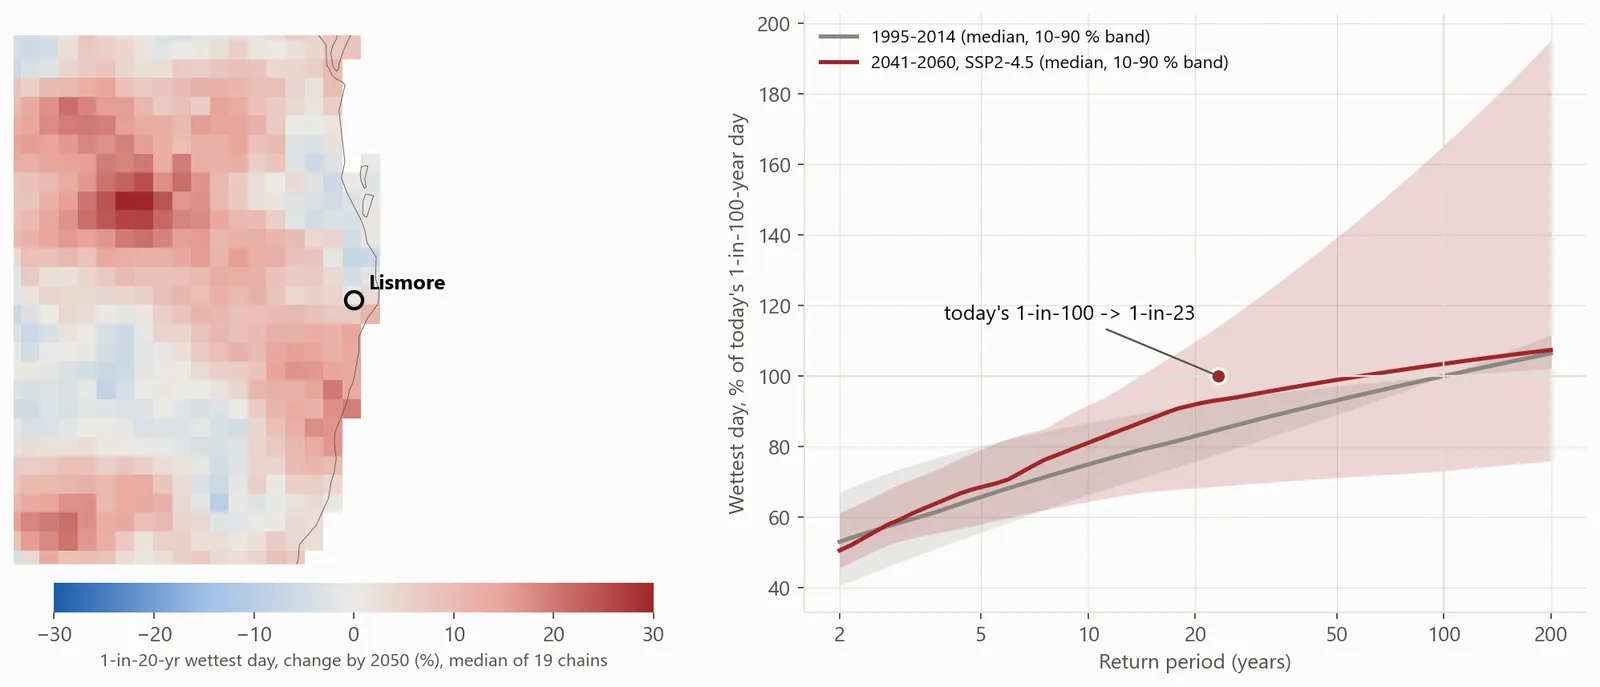
The typical heavy-rain day changes very little, but the tail changes. Only 8 of 19 chains make the 1-in-20 day heavier. But the median chain changes today's 1-in-100 day into a 1-in-23 day. About half of the households in Northern Rivers already pay more than one month of income for home insurance (Actuaries Institute). A view from a single model would not show one of these two results: the change in the tail or the disagreement between the chains.
Case 3 · New Zealand
Westport, West Coast
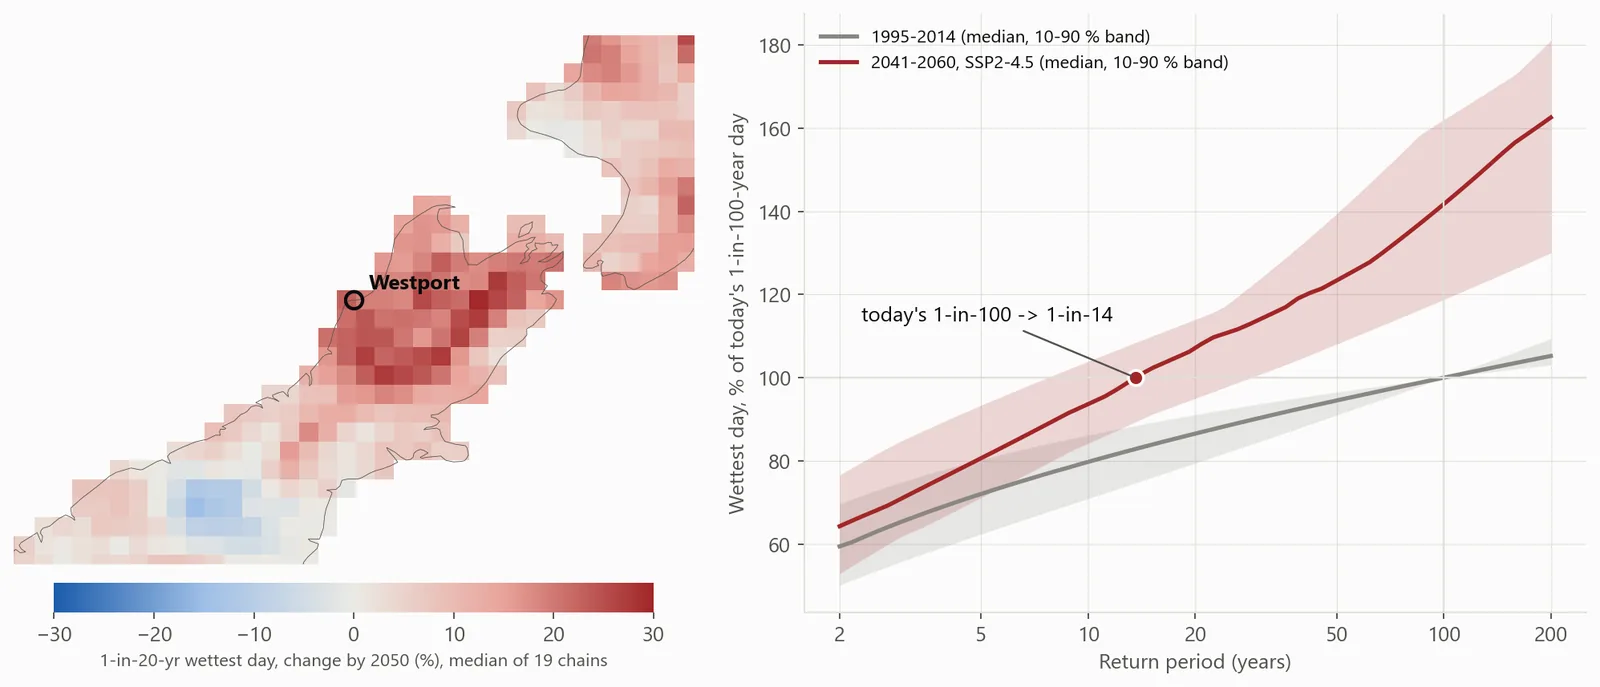
Of the six places, Westport has the clearest signal. All chains agree. The median 2050 curve is above the curve for today at each return period.
Case 4 · Pacific
Vanuatu
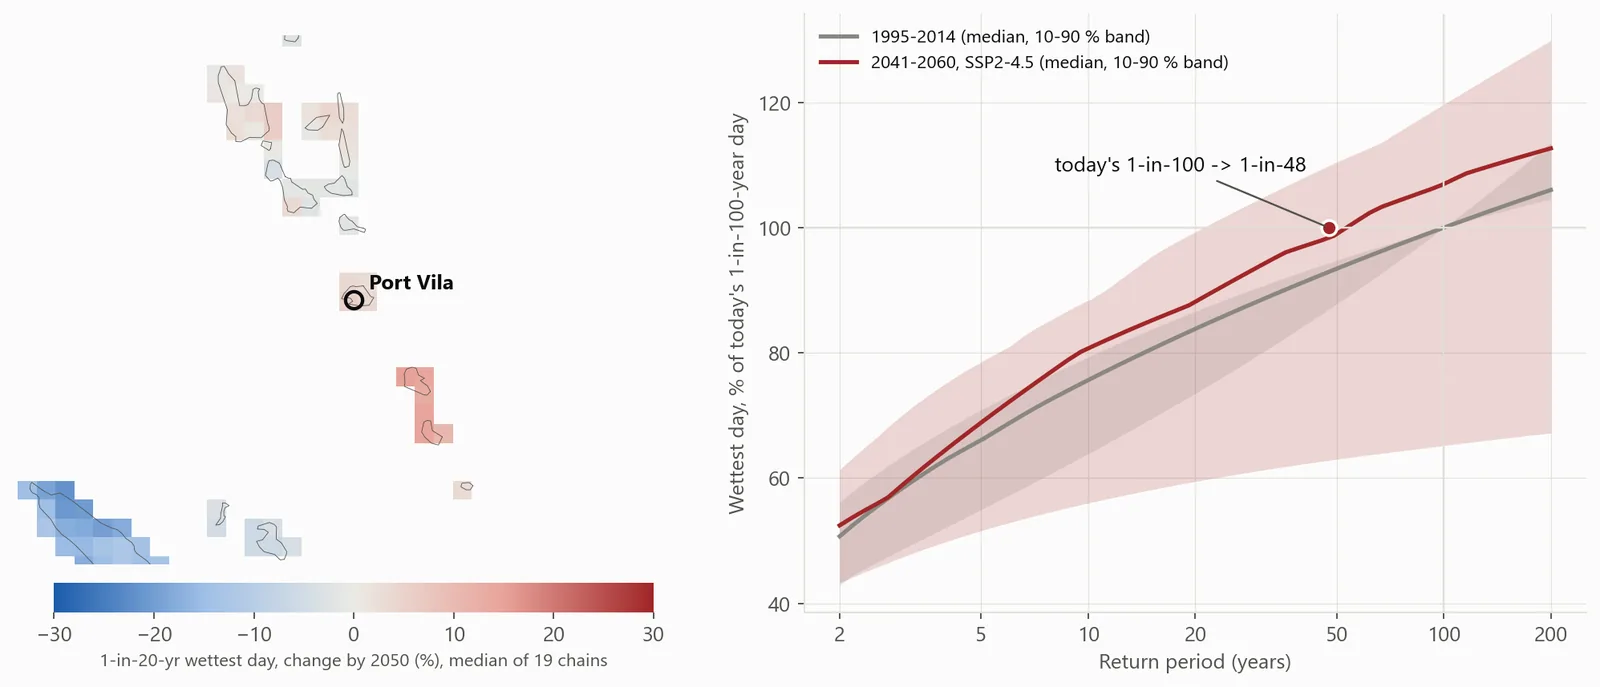
In 2023, Cyclones Judy and Kevin caused a further US$433 m of damage and loss. For the 1-in-20 day, the chains do not agree: the split is 11 to 8. A buyer of parametric insurance must see this uncertainty. Tropical-cyclone wind is not in this dataset at this time.
Case 5 · Pacific
Papua New Guinea
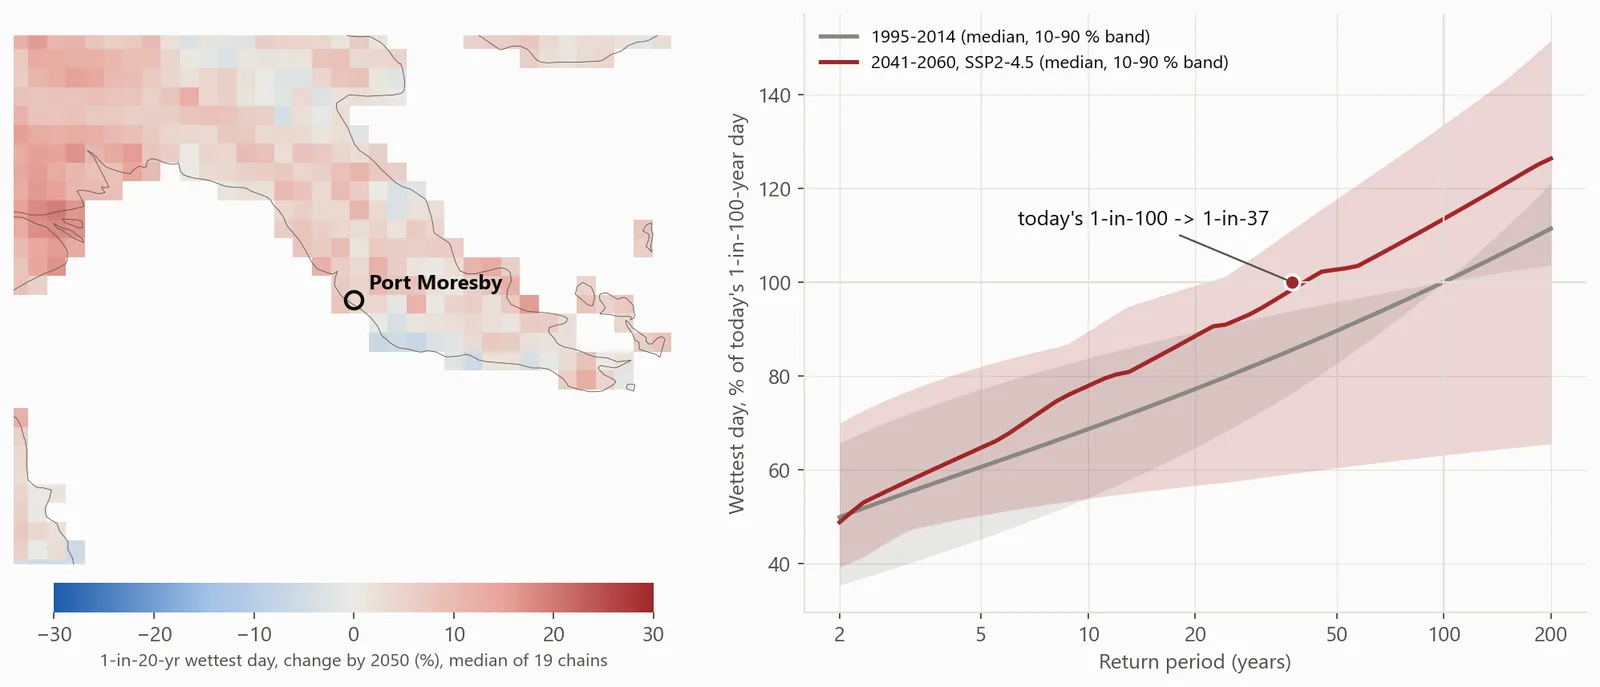
Case 6 · Southeast Asia
Timor-Leste: an uncertain result
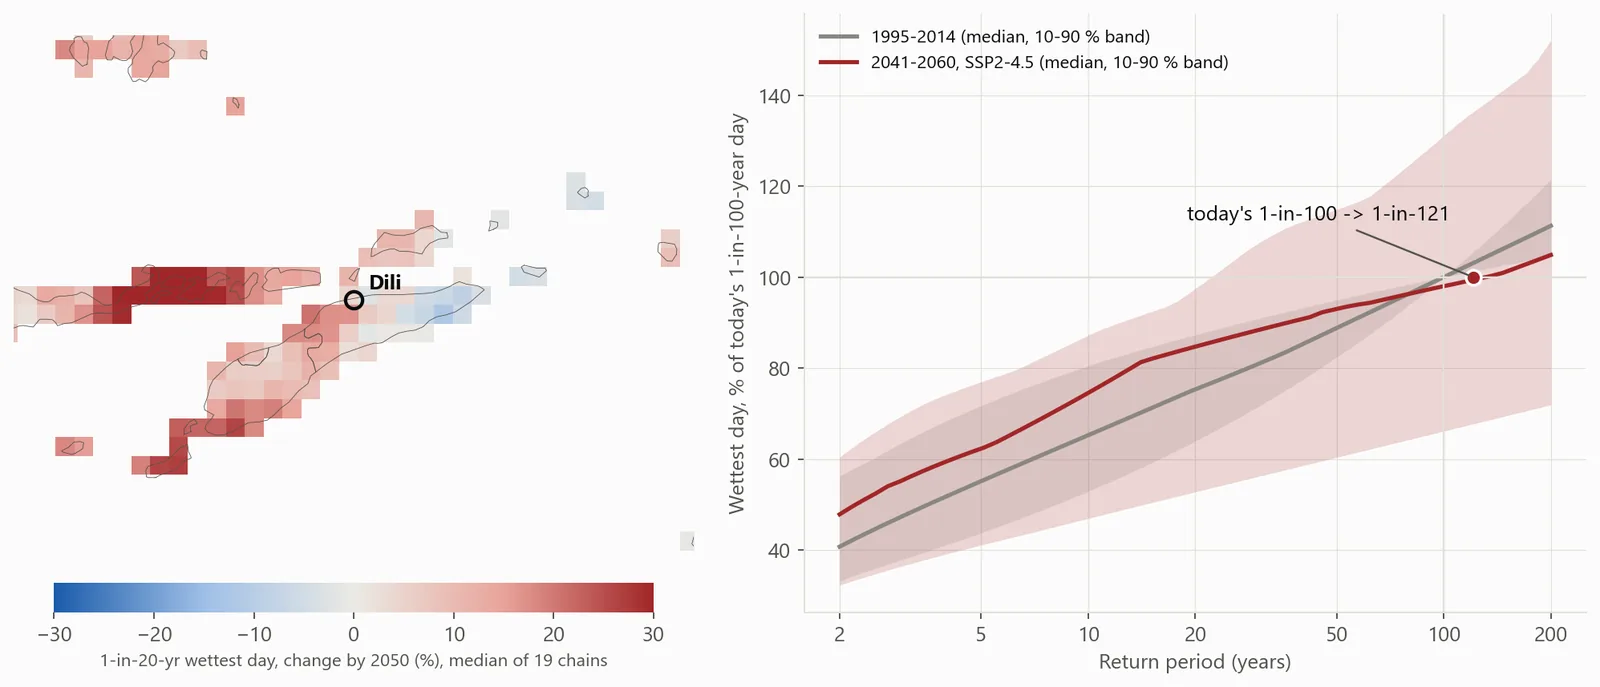
Here, the chains do not agree. This result is as useful as a strong signal. It tells a pool or a donor to calculate the amount of insurance from the present-day climate plus a wide margin, not from a single projection.
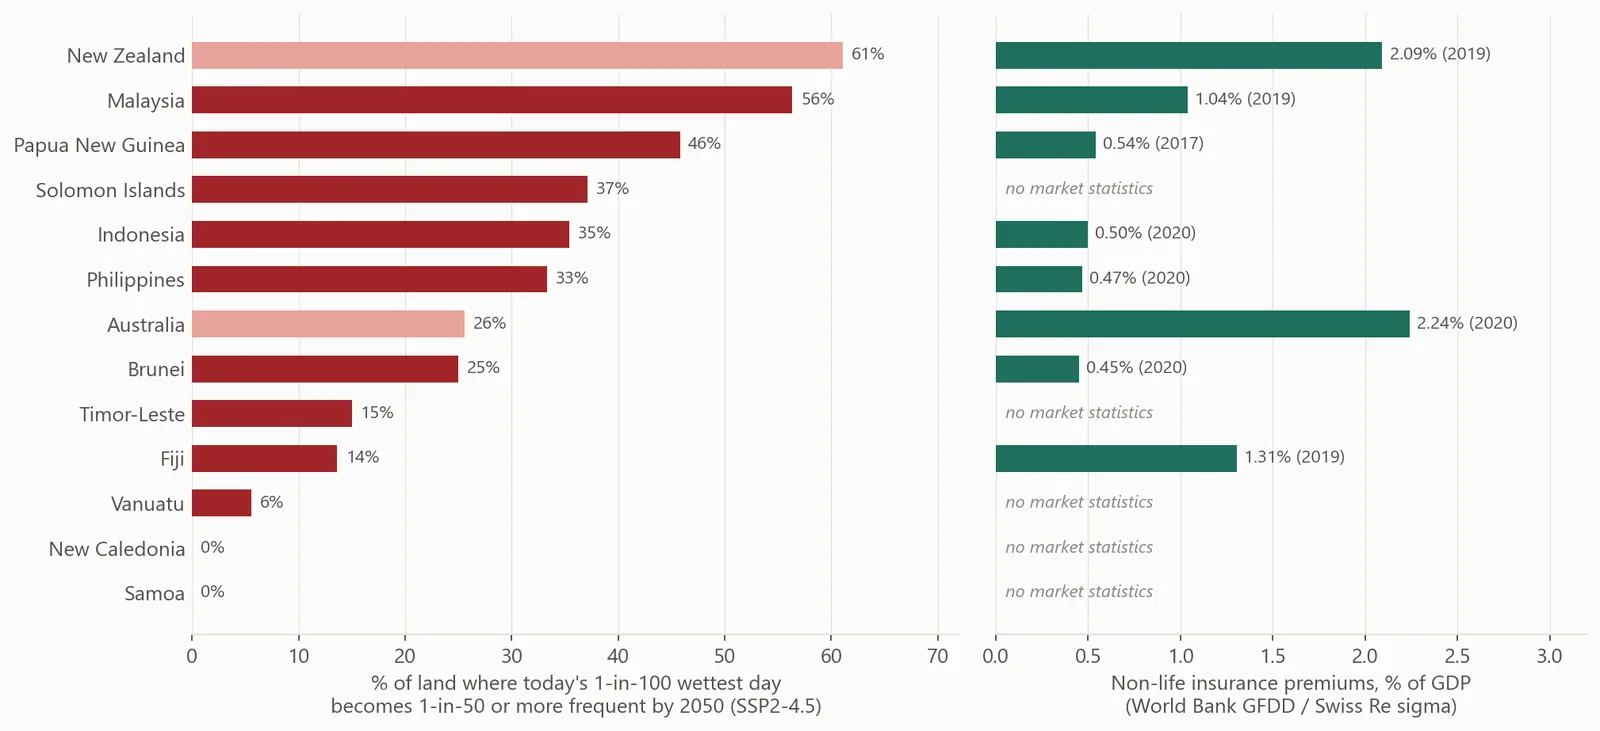
Extreme rain and insurance depth in the Pacific
The left side shows the increase in extremes. The right side shows insurance depth. For reference, the pale bars show the two markets that have insurance.
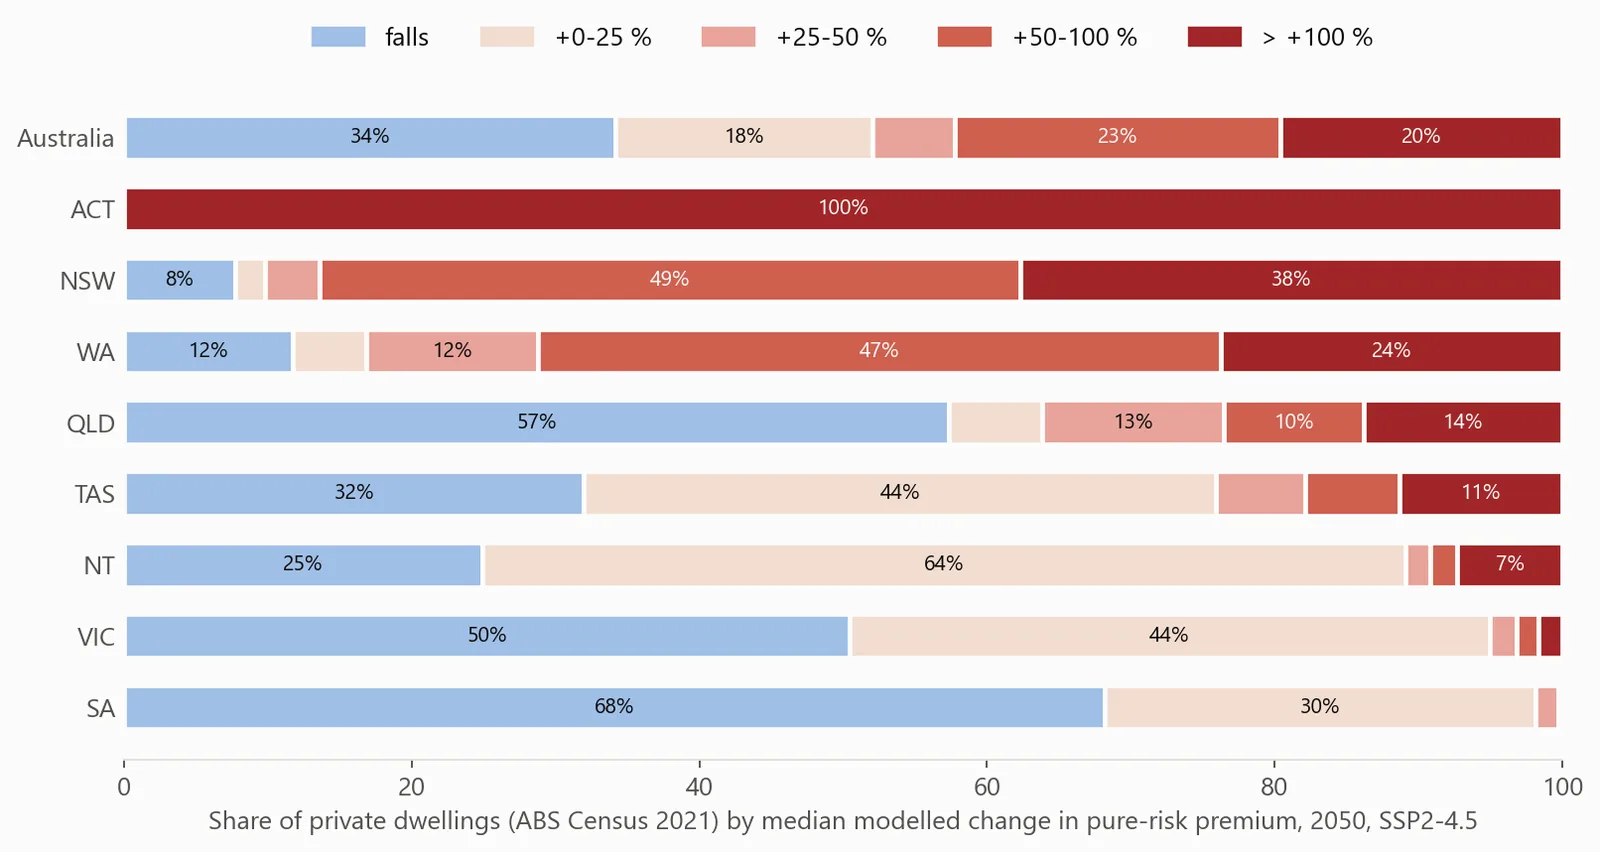
Australia: dwellings with premium pressure
The chart shows the modelled change in the pure-risk premium of a reference house. We weight the values by Census dwellings. The model uses illustrative damage curves for only two perils: surface-water flood and wind. Thus, read the result as relative pressure, not as a price.
Download the figure data
The numbers behind the charts on this page, as CSV files. To get any indicator for your own areas (Australian postcodes, SA1 to SA4, LGAs, or New Zealand SA1, SA2, territorial authorities and regional councils), use the download in the panel of the Explore and Insurability maps.
The figure data loads…
How to read these numbers
- The hazard is the wettest day of the year at 0.25° (about 25 km). It is a proxy for surface-water flood. Riverine depth, storm surge, cyclone wind, bushfire and hail are not in this dataset at this time.
- The downscaling has no bias correction. Thus, we calculate each change for each chain against its own 1995–2014 baseline. Then we calculate the percentiles.
- Return periods come from GEV fits to 20 annual maxima for each chain. After about 1-in-50, the results depend on the shape of the fitted tail.
- The "19 chains" are the five GCMs with scenario runs, multiplied by their downscaling models. HadGEM3-GC31-LL has only a historical run.
Sources
- Swiss Re Institute, sigma 1/2025 and natcat protection gap 2025.
- World Bank Global Financial Development Database (GFDD.DI.10, non-life premiums % GDP) and population (SP.POP.TOTL).
- ACCC Northern Australia Insurance Inquiry; ARPC Cyclone Reinsurance Pool.
- Insurance Council of Australia, 2022 flood; Lismore flood cover; Actuaries Institute, Home insurance affordability (2024).
- Insurance Council of New Zealand, July 2021 Westport flood data.
- Government of Vanuatu, Cyclone Pam PDNA; World Bank, PCRAFI payout; ILO, Judy and Kevin PDNA.
- Adults insured: Reserve Bank of Fiji demand-side survey 2025; PFIP surveys for Samoa, Tonga and Vanuatu; Kenya FinAccess 2024; EFInA Nigeria 2023; FSD Tanzania; FinScope Malawi 2023; Cenfri (South Africa); press reports for Zimbabwe, Rwanda and Zambia.
- Insured share of losses: Aon Climate & Catastrophe Insight 2025; Munich Re through FAnews (Africa 1980–2018).
- Hazard: ClimMate CMIP6 ensemble with ML downscaling (dataset ens-2026-10). Methods: Curran et al. (2026), TMLR; Curran et al. (2024), arXiv:2411.14774.